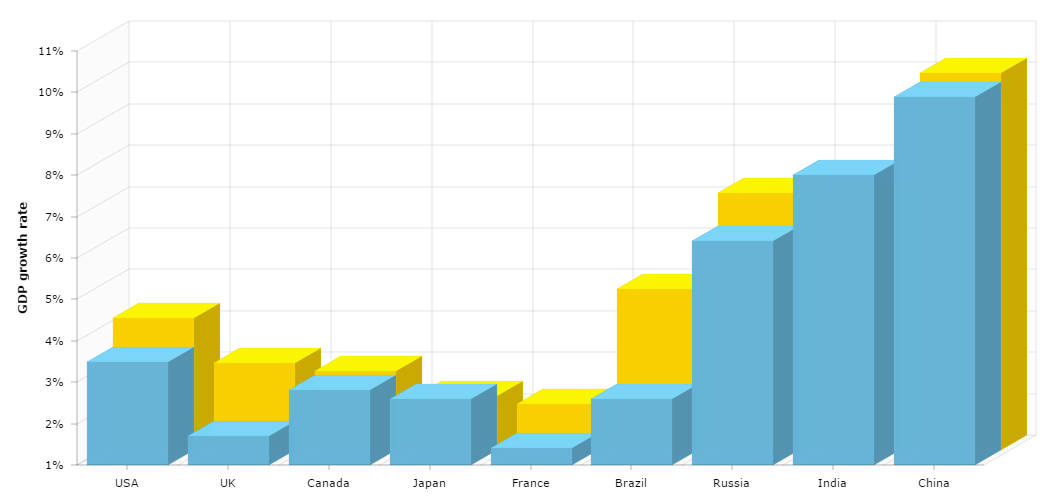
3D Stacked Column Chart
3D stacked columns are placed one behind another instead of placing them one on top of another (regular stacking or 100% stacking). This kind of stacking is limited to column graphs only, as only these graphs do support 3D look. You can stack more than two graphs, just remember to put the graphs with the highest values to the back, as otherwise thy will hide the graphs with smaller values.
Demo source
<!-- Styles -->
<style>
#chartdiv {
  width: 100%;
  height: 500px;
}
</style>

<!-- Resources -->
<script src="https://www.amcharts.com/lib/3/amcharts.js"></script>
<script src="https://www.amcharts.com/lib/3/serial.js"></script>
<script src="https://www.amcharts.com/lib/3/plugins/export/export.min.js"></script>
<link rel="stylesheet" href="https://www.amcharts.com/lib/3/plugins/export/export.css" type="text/css" media="all" />

<!-- Chart code -->
<script>
var chart = AmCharts.makeChart("chartdiv", {
    "theme": "none",
    "type": "serial",
    "dataProvider": [{
        "country": "USA",
        "year2004": 3.5,
        "year2005": 4.2
    }, {
        "country": "UK",
        "year2004": 1.7,
        "year2005": 3.1
    }, {
        "country": "Canada",
        "year2004": 2.8,
        "year2005": 2.9
    }, {
        "country": "Japan",
        "year2004": 2.6,
        "year2005": 2.3
    }, {
        "country": "France",
        "year2004": 1.4,
        "year2005": 2.1
    }, {
        "country": "Brazil",
        "year2004": 2.6,
        "year2005": 4.9
    }, {
        "country": "Russia",
        "year2004": 6.4,
        "year2005": 7.2
    }, {
        "country": "India",
        "year2004": 8,
        "year2005": 7.1
    }, {
        "country": "China",
        "year2004": 9.9,
        "year2005": 10.1
    }],
    "valueAxes": [{
        "stackType": "3d",
        "unit": "%",
        "position": "left",
        "title": "GDP growth rate",
    }],
    "startDuration": 1,
    "graphs": [{
        "balloonText": "GDP grow in [[category]] (2004): <b>[[value]]</b>",
        "fillAlphas": 0.9,
        "lineAlpha": 0.2,
        "title": "2004",
        "type": "column",
        "valueField": "year2004"
    }, {
        "balloonText": "GDP grow in [[category]] (2005): <b>[[value]]</b>",
        "fillAlphas": 0.9,
        "lineAlpha": 0.2,
        "title": "2005",
        "type": "column",
        "valueField": "year2005"
    }],
    "plotAreaFillAlphas": 0.1,
    "depth3D": 60,
    "angle": 30,
    "categoryField": "country",
    "categoryAxis": {
        "gridPosition": "start"
    },
    "export": {
    	"enabled": true
     }
});
jQuery('.chart-input').off().on('input change',function() {
	var property	= jQuery(this).data('property');
	var target		= chart;
	chart.startDuration = 0;

	if ( property == 'topRadius') {
		target = chart.graphs[0];
      	if ( this.value == 0 ) {
          this.value = undefined;
      	}
	}

	target[property] = this.value;
	chart.validateNow();
});
</script>

<!-- HTML -->
<div id="chartdiv"></div>