Animations Along Lines
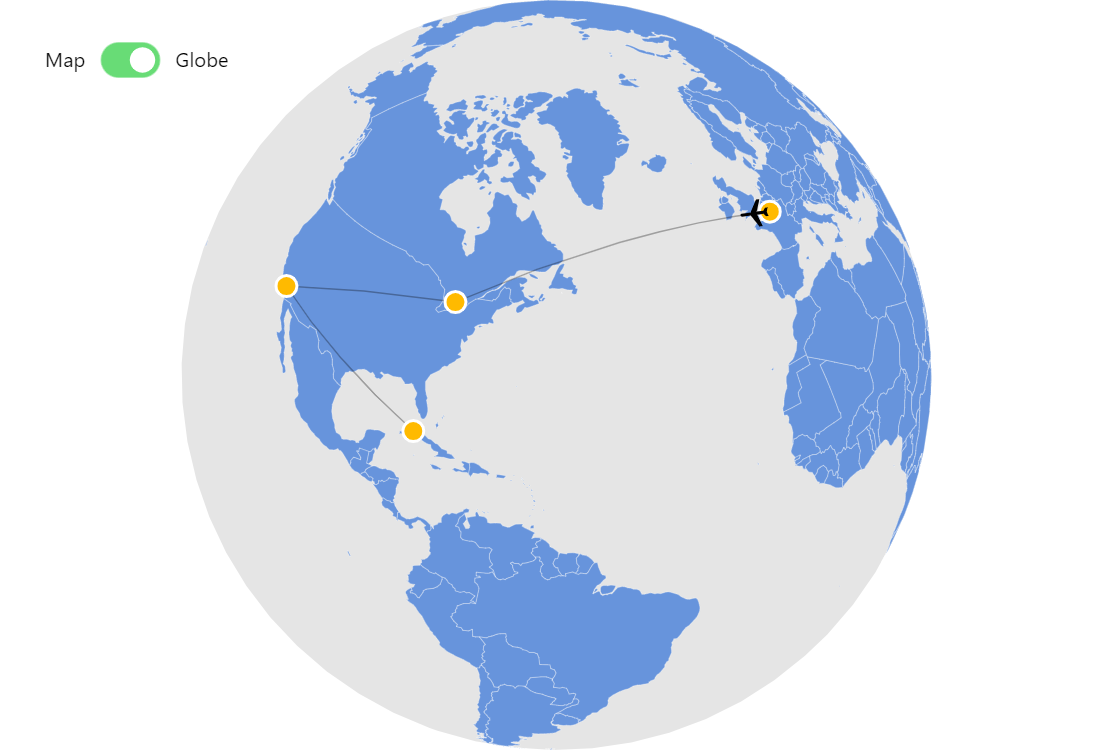
amCharts Map Chart has all the tools you need to connect points on a map taking the geography and geometry into account. And then you can even animate objects along those connecting lines.
Key implementation details
We create MapLineSeries to represent our lines. We set it up by providing pointsToConnect. Then we create MapPointSeries to represent the position of our plane. We set it up by setting lineDataItem to our map line series and then we animate positionOnLine.
Related tutorials
Demo source
<!-- Styles -->
<style>
#chartdiv {
  width: 100%;
  height: 550px;
}
</style>

<!-- Resources -->
<script src="https://cdn.amcharts.com/lib/5/index.js"></script>
<script src="https://cdn.amcharts.com/lib/5/map.js"></script>
<script src="https://cdn.amcharts.com/lib/5/geodata/worldLow.js"></script>
<script src="https://cdn.amcharts.com/lib/5/themes/Animated.js"></script>

<!-- Chart code -->
<script>
am5.ready(function() {

// Create root element
// https://www.amcharts.com/docs/v5/getting-started/#Root_element
var root = am5.Root.new("chartdiv");

// Set themes
// https://www.amcharts.com/docs/v5/concepts/themes/
root.setThemes([
  am5themes_Animated.new(root)
]);

// Create the map chart
// https://www.amcharts.com/docs/v5/charts/map-chart/
var chart = root.container.children.push(am5map.MapChart.new(root, {
  panX: "rotateX",
  panY: "translateY",
  projection: am5map.geoMercator(),
  homeGeoPoint: { latitude: 2, longitude: 2 }
}));

var cont = chart.children.push(am5.Container.new(root, {
  layout: root.horizontalLayout,
  x: 20,
  y: 40
}));

// Add labels and controls
cont.children.push(am5.Label.new(root, {
  centerY: am5.p50,
  text: "Map"
}));

var switchButton = cont.children.push(am5.Button.new(root, {
  themeTags: ["switch"],
  centerY: am5.p50,
  icon: am5.Circle.new(root, {
    themeTags: ["icon"]
  })
}));

switchButton.on("active", function() {
  if (!switchButton.get("active")) {
    chart.set("projection", am5map.geoMercator());
    chart.set("panY", "translateY");
    chart.set("rotationY", 0);
    backgroundSeries.mapPolygons.template.set("fillOpacity", 0);
  } else {
    chart.set("projection", am5map.geoOrthographic());
    chart.set("panY", "rotateY")

    backgroundSeries.mapPolygons.template.set("fillOpacity", 0.1);
  }
});

cont.children.push(
  am5.Label.new(root, {
    centerY: am5.p50,
    text: "Globe"
  })
);

// Create series for background fill
// https://www.amcharts.com/docs/v5/charts/map-chart/map-polygon-series/#Background_polygon
var backgroundSeries = chart.series.push(am5map.MapPolygonSeries.new(root, {}));
backgroundSeries.mapPolygons.template.setAll({
  fill: root.interfaceColors.get("alternativeBackground"),
  fillOpacity: 0,
  strokeOpacity: 0
});

// Add background polygon
// https://www.amcharts.com/docs/v5/charts/map-chart/map-polygon-series/#Background_polygon
backgroundSeries.data.push({
  geometry: am5map.getGeoRectangle(90, 180, -90, -180)
});

// Create main polygon series for countries
// https://www.amcharts.com/docs/v5/charts/map-chart/map-polygon-series/
var polygonSeries = chart.series.push(am5map.MapPolygonSeries.new(root, {
  geoJSON: am5geodata_worldLow
}));

// Create line series for trajectory lines
// https://www.amcharts.com/docs/v5/charts/map-chart/map-line-series/
var lineSeries = chart.series.push(am5map.MapLineSeries.new(root, {}));
lineSeries.mapLines.template.setAll({
  stroke: root.interfaceColors.get("alternativeBackground"),
  strokeOpacity: 0.3
});

// Create point series for markers
// https://www.amcharts.com/docs/v5/charts/map-chart/map-point-series/
var pointSeries = chart.series.push(am5map.MapPointSeries.new(root, {}));

pointSeries.bullets.push(function() {
  var circle = am5.Circle.new(root, {
    radius: 7,
    tooltipText: "Drag me!",
    cursorOverStyle: "pointer",
    tooltipY: 0,
    fill: am5.color(0xffba00),
    stroke: root.interfaceColors.get("background"),
    strokeWidth: 2,
    draggable: true
  });

  circle.events.on("dragged", function(event) {
    var dataItem = event.target.dataItem;
    var projection = chart.get("projection");
    var geoPoint = chart.invert({ x: circle.x(), y: circle.y() });

    dataItem.setAll({
      longitude: geoPoint.longitude,
      latitude: geoPoint.latitude
    });
  });

  return am5.Bullet.new(root, {
    sprite: circle
  });
});

var paris = addCity({ latitude: 48.8567, longitude: 2.351 }, "Paris");
var toronto = addCity({ latitude: 43.8163, longitude: -79.4287 }, "Toronto");
var la = addCity({ latitude: 34.3, longitude: -118.15 }, "Los Angeles");
var havana = addCity({ latitude: 23, longitude: -82 }, "Havana");

var lineDataItem = lineSeries.pushDataItem({
  pointsToConnect: [paris, toronto, la, havana]
});

var planeSeries = chart.series.push(am5map.MapPointSeries.new(root, {}));

var plane = am5.Graphics.new(root, {
  svgPath:
    "m2,106h28l24,30h72l-44,-133h35l80,132h98c21,0 21,34 0,34l-98,0 -80,134h-35l43,-133h-71l-24,30h-28l15,-47",
  scale: 0.06,
  centerY: am5.p50,
  centerX: am5.p50,
  fill: am5.color(0x000000)
});

planeSeries.bullets.push(function() {
  var container = am5.Container.new(root, {});
  container.children.push(plane);
  return am5.Bullet.new(root, { sprite: container });
});


var planeDataItem = planeSeries.pushDataItem({
  lineDataItem: lineDataItem,
  positionOnLine: 0,
  autoRotate: true
});
planeDataItem.dataContext = {};

planeDataItem.animate({
  key: "positionOnLine",
  to: 1,
  duration: 10000,
  loops: Infinity,
  easing: am5.ease.yoyo(am5.ease.linear)
});

planeDataItem.on("positionOnLine", (value) => {
  if (planeDataItem.dataContext.prevPosition < value) {
    plane.set("rotation", 0);
  }

  if (planeDataItem.dataContext.prevPosition > value) {
    plane.set("rotation", -180);
  }
  planeDataItem.dataContext.prevPosition = value;
});

function addCity(coords, title) {
  return pointSeries.pushDataItem({
    latitude: coords.latitude,
    longitude: coords.longitude
  });
}

// Make stuff animate on load
chart.appear(1000, 100);

}); // end am5.ready()
</script>

<!-- HTML -->
<div id="chartdiv"></div>