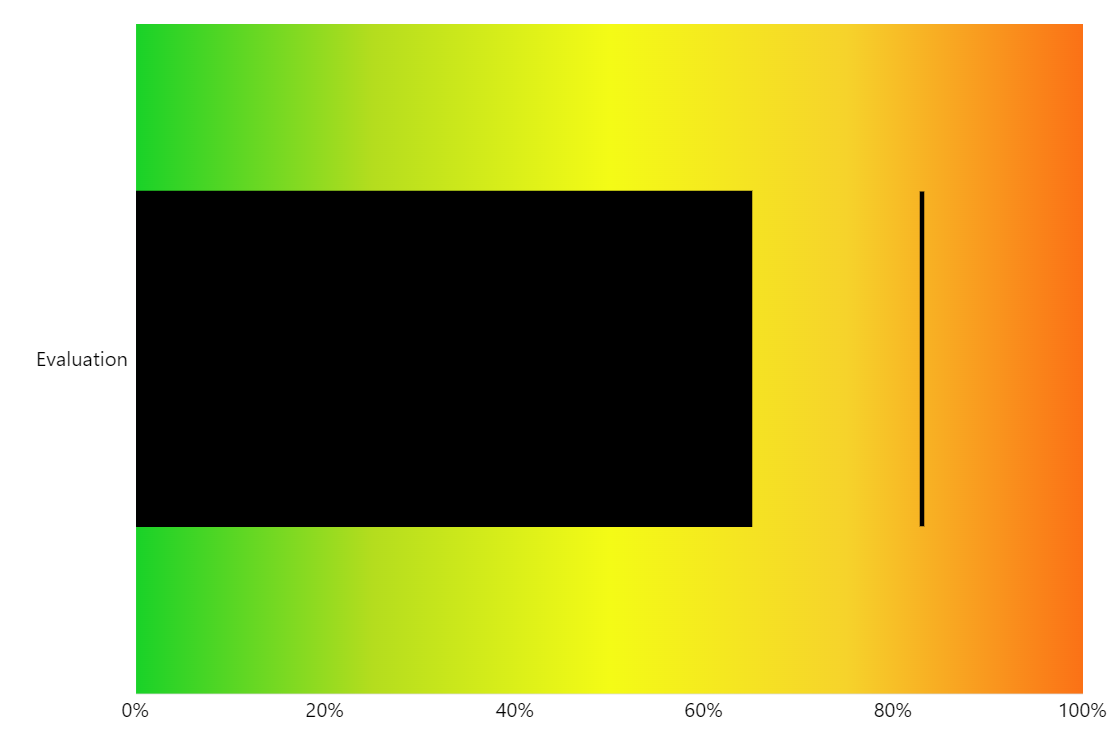
Bullet Chart
Bullet Chart (also know as Bullet graph) is a great replacement for traditional dashboard gauges and meters. It empowers to display way more information in a more compact space by getting rid of unnecessary decoration in favor of data clarity and usability.
Related tutorials
Demo source
<!-- Styles -->
<style>
#chartdiv0, #chartdiv1 {
width: 100%;
height: 200px;
}
</style>
<!-- Resources -->
<script src="https://cdn.amcharts.com/lib/5/index.js"></script>
<script src="https://cdn.amcharts.com/lib/5/xy.js"></script>
<script src="https://cdn.amcharts.com/lib/5/themes/Animated.js"></script>
<!-- Chart code -->
<script>
am5.ready(function() {
function createBulletChart(divId, gradient) {
var colors = [
am5.color(0x19d228),
am5.color(0xb4dd1e),
am5.color(0xf4fb16),
am5.color(0xf6d32b),
am5.color(0xfb7116)
];
// Create root element
// https://www.amcharts.com/docs/v5/getting-started/#Root_element
var root = am5.Root.new(divId);
// Set themes
// https://www.amcharts.com/docs/v5/concepts/themes/
root.setThemes([
am5themes_Animated.new(root)
]);
// Create chart
// https://www.amcharts.com/docs/v5/charts/xy-chart/
var chart = root.container.children.push(
am5xy.XYChart.new(root, {
panX: false,
panY: false,
wheelX: "none",
wheelY: "none",
arrangeTooltips: false
})
);
// Create axes
// https://www.amcharts.com/docs/v5/charts/xy-chart/axes/
var yAxis = chart.yAxes.push(
am5xy.CategoryAxis.new(root, {
categoryField: "category",
renderer: am5xy.AxisRendererY.new(root, {})
})
);
yAxis.data.setAll([{ category: "Evaluation" }]);
var xRenderer = am5xy.AxisRendererX.new(root, {});
xRenderer.grid.template.set("forceHidden", true);
var xAxis = chart.xAxes.push(
am5xy.ValueAxis.new(root, {
renderer: xRenderer,
min: 0,
max: 100,
numberFormat: "#.'%'"
})
);
// Add range
// https://www.amcharts.com/docs/v5/charts/xy-chart/series/
if (gradient) {
var rangeDataItem = xAxis.makeDataItem({ value: 0, endValue: 100 });
var range = xAxis.createAxisRange(rangeDataItem);
rangeDataItem.get("axisFill").setAll({
visible: true,
fillOpacity:1
});
var stops = [];
for (var i = 0; i < colors.length; i++) {
stops.push({ color: colors[i] });
}
var linearGradient = am5.LinearGradient.new(root, {
rotation: 0,
stops: stops
});
rangeDataItem.get("axisFill").set("fillGradient", linearGradient);
} else {
var count = colors.length;
for (var i = 0; i < count; i++) {
var rangeDataItem = xAxis.makeDataItem({
value: (i / count) * 100,
endValue: ((i + 1) / count) * 100
});
var range = xAxis.createAxisRange(rangeDataItem);
rangeDataItem.get("axisFill").setAll({
visible: true,
fill: colors[i],
stroke: colors[i],
fillOpacity:1
});
}
}
var series = chart.series.push(
am5xy.ColumnSeries.new(root, {
xAxis: xAxis,
yAxis: yAxis,
valueXField: "value",
categoryYField: "category",
fill: am5.color(0x000000),
stroke: am5.color(0x000000),
tooltip: am5.Tooltip.new(root, {
pointerOrientation: "left",
labelText: "{valueX}%"
})
})
);
series.columns.template.setAll({
height: am5.p50
});
series.data.setAll([{ category: "Evaluation", value: 65 }]);
var stepSeries = chart.series.push(
am5xy.StepLineSeries.new(root, {
xAxis: xAxis,
yAxis: yAxis,
valueXField: "value",
categoryYField: "category",
stroke: am5.color(0x000000),
fill: am5.color(0x000000),
noRisers: true,
stepWidth: am5.p50,
tooltip: am5.Tooltip.new(root, {
pointerOrientation: "left",
labelText: "{valueX}%"
})
})
);
stepSeries.strokes.template.set("strokeWidth", 3);
stepSeries.data.setAll([{ category: "Evaluation", value: 83 }]);
// Add cursor
// https://www.amcharts.com/docs/v5/charts/xy-chart/cursor/
var cursor = chart.set("cursor", am5xy.XYCursor.new(root, {
behavior: "none"
})
);
cursor.lineY.set("visible", false);
cursor.lineX.set("visible", false);
// Make stuff animate on load
// https://www.amcharts.com/docs/v5/concepts/animations/
chart.appear(1000, 100);
series.appear();
stepSeries.appear();
}
createBulletChart("chartdiv0", true);
createBulletChart("chartdiv1", false);
}); // end am5.ready()
</script>
<!-- HTML -->
<div id="chartdiv0"></div>
<div id="chartdiv1"></div>