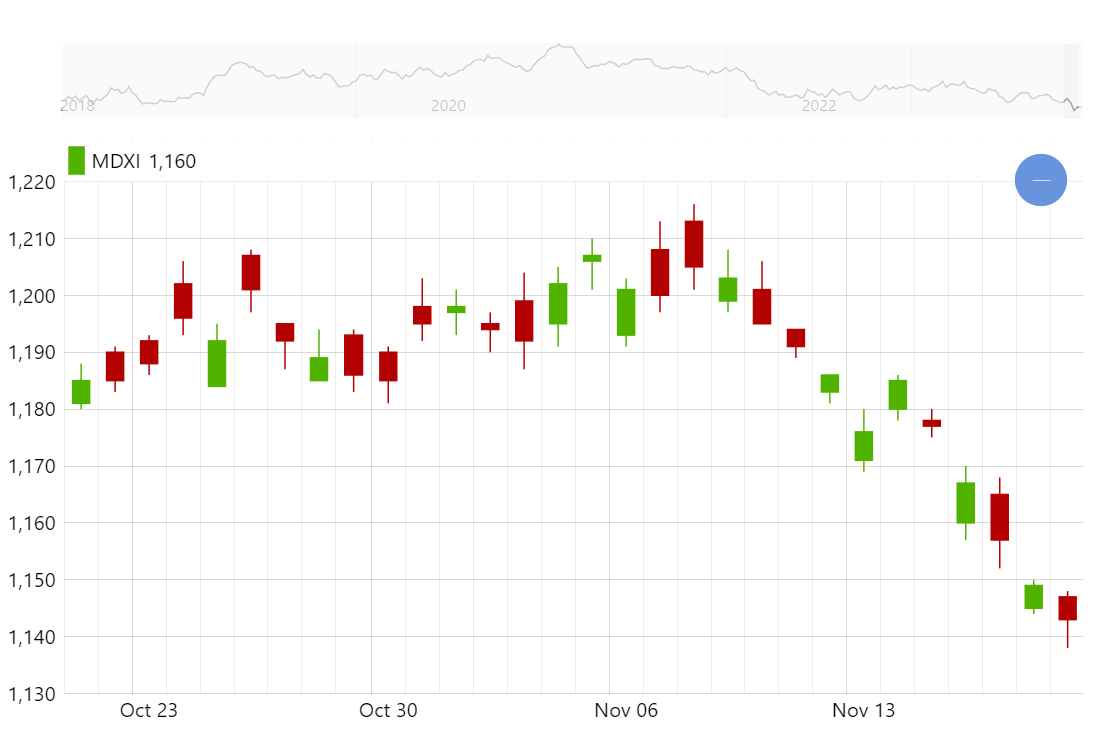
Candlestick Chart
Candlestick chart is one of the most common ways to display financial data such as stock trading prices over time. Creating candlestick charts with amCharts is really easy and you get a lot of advanced features such as grouping right out of the box (try zooming in and out).
Key implementation details
To create a candlestick chart we add CandlestickSeries to an XYChart. We configure all the value fields for open/close/low/high values and also for grouping (lowValueYGrouped, etc.). We enable grouping by setting groupData to true on the DateAxis (X axis in this demo). And the engine takes care of the rest.
Related tutorials
Demo source
<!-- Styles -->
<style>
#chartdiv {
  width: 100%;
  height: 500px;
max-width: 100%
}
</style>

<!-- Resources -->
<script src="https://cdn.amcharts.com/lib/5/index.js"></script>
<script src="https://cdn.amcharts.com/lib/5/xy.js"></script>
<script src="https://cdn.amcharts.com/lib/5/themes/Animated.js"></script>

<!-- Chart code -->
<script>
am5.ready(function() {

// Create root element
// https://www.amcharts.com/docs/v5/getting-started/#Root_element
var root = am5.Root.new("chartdiv");

const myTheme = am5.Theme.new(root);

myTheme.rule("Grid", ["scrollbar", "minor"]).setAll({
  visible:false
});

root.setThemes([
  am5themes_Animated.new(root),
  myTheme
]);

function generateChartData() {
  var chartData = [];
  var firstDate = new Date();
  firstDate.setDate(firstDate.getDate() - 2000);
  firstDate.setHours(0, 0, 0, 0);
  var value = 1200;
  for (var i = 0; i < 2000; i++) {
    var newDate = new Date(firstDate);
    newDate.setDate(newDate.getDate() + i);

    value += Math.round((Math.random() < 0.5 ? 1 : -1) * Math.random() * 10);
    var open = value + Math.round(Math.random() * 16 - 8);
    var low = Math.min(value, open) - Math.round(Math.random() * 5);
    var high = Math.max(value, open) + Math.round(Math.random() * 5);

    chartData.push({
      date: newDate.getTime(),
      value: value,
      open: open,
      low: low,
      high: high
    });
  }
  return chartData;
}

var data = generateChartData();

// Create chart
// https://www.amcharts.com/docs/v5/charts/xy-chart/
var chart = root.container.children.push(
  am5xy.XYChart.new(root, {
    focusable: true,
    panX: true,
    panY: true,
    wheelX: "panX",
    wheelY: "zoomX",
    paddingLeft: 0
  })
);

// Create axes
// https://www.amcharts.com/docs/v5/charts/xy-chart/axes/
var xAxis = chart.xAxes.push(
  am5xy.DateAxis.new(root, {
    groupData: true,
    maxDeviation: 0.5,
    baseInterval: { timeUnit: "day", count: 1 },
    renderer: am5xy.AxisRendererX.new(root, {
      pan: "zoom",
      minorGridEnabled: true
    }),
    tooltip: am5.Tooltip.new(root, {})
  })
);

var yAxis = chart.yAxes.push(
  am5xy.ValueAxis.new(root, {
    maxDeviation: 1,
    renderer: am5xy.AxisRendererY.new(root, {
      pan: "zoom"
    })
  })
);

var color = root.interfaceColors.get("background");

// Add series
// https://www.amcharts.com/docs/v5/charts/xy-chart/series/
var series = chart.series.push(
  am5xy.CandlestickSeries.new(root, {
    fill: color,
    calculateAggregates: true,
    stroke: color,
    name: "MDXI",
    xAxis: xAxis,
    yAxis: yAxis,
    valueYField: "value",
    openValueYField: "open",
    lowValueYField: "low",
    highValueYField: "high",
    valueXField: "date",
    lowValueYGrouped: "low",
    highValueYGrouped: "high",
    openValueYGrouped: "open",
    valueYGrouped: "close",
    legendValueText:
      "open: {openValueY} low: {lowValueY} high: {highValueY} close: {valueY}",
    legendRangeValueText: "{valueYClose}",
    tooltip: am5.Tooltip.new(root, {
      pointerOrientation: "horizontal",
      labelText: "open: {openValueY}\nlow: {lowValueY}\nhigh: {highValueY}\nclose: {valueY}"
    })
  })
);

// Add cursor
// https://www.amcharts.com/docs/v5/charts/xy-chart/cursor/
var cursor = chart.set(
  "cursor",
  am5xy.XYCursor.new(root, {
    xAxis: xAxis
  })
);
cursor.lineY.set("visible", false);

// Stack axes vertically
// https://www.amcharts.com/docs/v5/charts/xy-chart/axes/#Stacked_axes
chart.leftAxesContainer.set("layout", root.verticalLayout);

// Add scrollbar
// https://www.amcharts.com/docs/v5/charts/xy-chart/scrollbars/
var scrollbar = am5xy.XYChartScrollbar.new(root, {
  orientation: "horizontal",
  height: 50
});
chart.set("scrollbarX", scrollbar);

var sbxAxis = scrollbar.chart.xAxes.push(
  am5xy.DateAxis.new(root, {
    groupData: true,
    groupIntervals: [{
      timeUnit: "week",
      count: 1
    }],
    baseInterval: { timeUnit: "day", count: 1 },
    renderer: am5xy.AxisRendererX.new(root, {
      minorGridEnabled: true,
      strokeOpacity: 0
    })
  })
);

var sbyAxis = scrollbar.chart.yAxes.push(
  am5xy.ValueAxis.new(root, {
    renderer: am5xy.AxisRendererY.new(root, {})
  })
);

var sbseries = scrollbar.chart.series.push(
  am5xy.LineSeries.new(root, {
    xAxis: sbxAxis,
    yAxis: sbyAxis,
    valueYField: "value",
    valueXField: "date"
  })
);

// Add legend
// https://www.amcharts.com/docs/v5/charts/xy-chart/legend-xy-series/
var legend = yAxis.axisHeader.children.push(am5.Legend.new(root, {}));

legend.data.push(series);

legend.markers.template.setAll({
  width: 10
});

legend.markerRectangles.template.setAll({
  cornerRadiusTR: 0,
  cornerRadiusBR: 0,
  cornerRadiusTL: 0,
  cornerRadiusBL: 0
});

// set data
series.data.setAll(data);
sbseries.data.setAll(data);

// Make stuff animate on load
// https://www.amcharts.com/docs/v5/concepts/animations/
series.appear(1000);
chart.appear(1000, 100);

}); // end am5.ready()
</script>

<!-- HTML -->
<div id="chartdiv"></div>