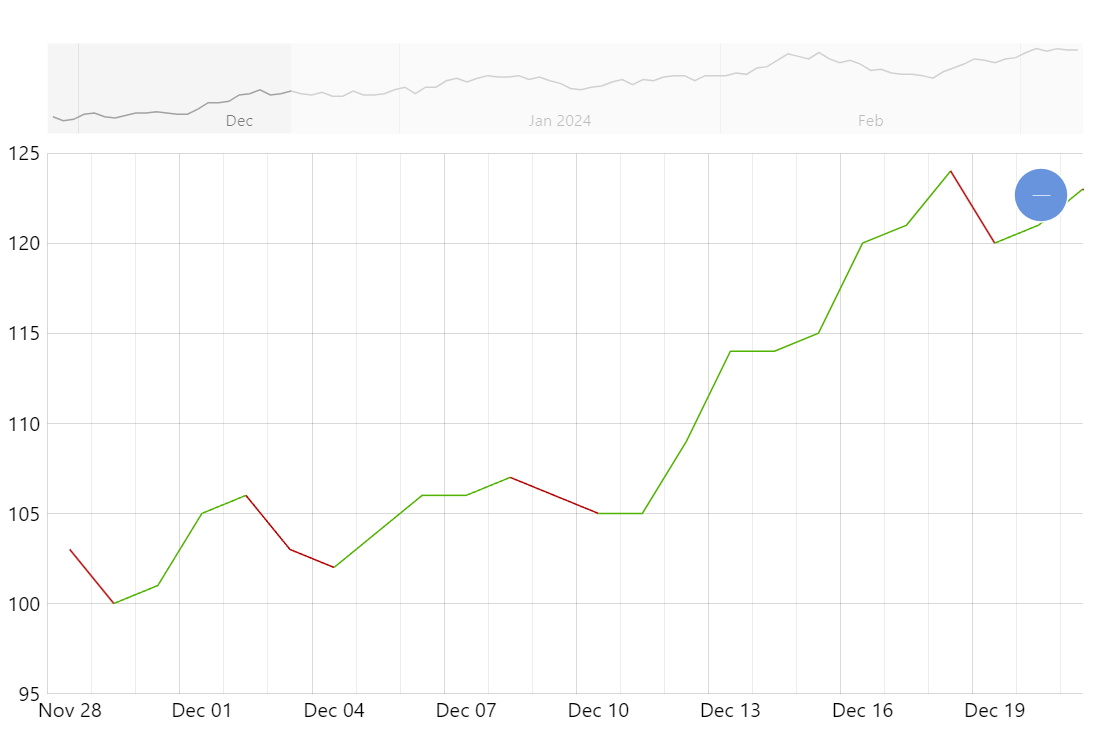
Line with Different Colors for Ups and Downs
Sometimes it’s great to emphasize the trend in data by coloring the line according to the direction of value changes.
Key implementation details
The key here is “massaging” the data to add a color field according to the trend. Then we can use that data field in the strokes.template for the series.
Additionally, we adjust the tooltip background color each time tooltip position changes using the color from the data item it’s pointing to.
Related tutorials
Demo source
<!-- Styles -->
<style>
#chartdiv {
  width: 100%;
  height: 500px;
}
</style>

<!-- Resources -->
<script src="https://cdn.amcharts.com/lib/5/index.js"></script>
<script src="https://cdn.amcharts.com/lib/5/xy.js"></script>
<script src="https://cdn.amcharts.com/lib/5/themes/Animated.js"></script>

<!-- Chart code -->
<script>
am5.ready(function() {

// Create root element
// https://www.amcharts.com/docs/v5/getting-started/#Root_element
var root = am5.Root.new("chartdiv");

// Set themes
// https://www.amcharts.com/docs/v5/concepts/themes/
root.setThemes([
  am5themes_Animated.new(root)
]);

// Create chart
// https://www.amcharts.com/docs/v5/charts/xy-chart/
var chart = root.container.children.push(
  am5xy.XYChart.new(root, {
    panX: true,
    panY: true,
    wheelX: "panX",
    wheelY: "zoomX",
    pinchZoomX: true,
    paddingLeft: 0
  })
);

// Add cursor
// https://www.amcharts.com/docs/v5/charts/xy-chart/cursor/
var cursor = chart.set("cursor", am5xy.XYCursor.new(root, {
  behavior: "none"
}));
cursor.lineY.set("visible", false);

// Generate random data
var date = new Date();
date.setHours(0, 0, 0, 0);
var value = 100;
var previousValue = value;
var downColor = root.interfaceColors.get("negative");
var upColor = root.interfaceColors.get("positive");
var color;
var previousColor;
var previousDataObj;

function generateData() {
  value = Math.round(Math.random() * 10 - 5 + value);
  am5.time.add(date, "day", 1);

  if (value >= previousValue) {
    color = upColor;
  } else {
    color = downColor;
  }
  previousValue = value;

  var dataObj = { date: date.getTime(), value: value, color: color }; // color will be used for tooltip background

  // only if changed
  if (color != previousColor) {
    if (!previousDataObj) {
      previousDataObj = dataObj;
    }
    previousDataObj.strokeSettings = { stroke: color };
  }

  previousDataObj = dataObj;
  previousColor = color;

  return dataObj;
}

function generateDatas(count) {
  var data = [];
  for (var i = 0; i < count; ++i) {
    data.push(generateData());
  }
  return data;
}

// Create axes
// https://www.amcharts.com/docs/v5/charts/xy-chart/axes/
var xAxis = chart.xAxes.push(
  am5xy.DateAxis.new(root, {
    baseInterval: { timeUnit: "day", count: 1 },
    renderer: am5xy.AxisRendererX.new(root, {
      minorGridEnabled: true,
      minGridDistance: 70
    }),
    tooltip: am5.Tooltip.new(root, {})
  })
);

var yAxis = chart.yAxes.push(
  am5xy.ValueAxis.new(root, {
    renderer: am5xy.AxisRendererY.new(root, {})
  })
);

// Add series
// https://www.amcharts.com/docs/v5/charts/xy-chart/series/
var series = chart.series.push(
  am5xy.LineSeries.new(root, {
    name: "Series",
    xAxis: xAxis,
    yAxis: yAxis,
    valueYField: "value",
    valueXField: "date"
  })
);

series.strokes.template.set("templateField", "strokeSettings");

var tooltip = series.set("tooltip", am5.Tooltip.new(root, {
  labelText: "{valueY}"
}));

// this is added in ored adapter to be triggered each time position changes
tooltip.on("pointTo", function () {
  var background = tooltip.get("background");
  background.set("fill", background.get("fill"));
});

// tooltip bacground takes color from data item
tooltip.get("background").adapters.add("fill", function (fill) {
  if (tooltip.dataItem) {
    return tooltip.dataItem.dataContext.color;
  }
  return fill;
});

// Add scrollbar
// https://www.amcharts.com/docs/v5/charts/xy-chart/scrollbars/
var scrollbar = chart.set(
  "scrollbarX",
  am5xy.XYChartScrollbar.new(root, {
    orientation: "horizontal",
    height: 60
  })
);

var sbDateAxis = scrollbar.chart.xAxes.push(
  am5xy.DateAxis.new(root, {
    baseInterval: {
      timeUnit: "day",
      count: 1
    },
    renderer: am5xy.AxisRendererX.new(root, {})
  })
);

var sbValueAxis = scrollbar.chart.yAxes.push(
  am5xy.ValueAxis.new(root, {
    renderer: am5xy.AxisRendererY.new(root, {})
  })
);

var sbSeries = scrollbar.chart.series.push(
  am5xy.LineSeries.new(root, {
    valueYField: "value",
    valueXField: "date",
    xAxis: sbDateAxis,
    yAxis: sbValueAxis
  })
);

// Generate and set data
var data = generateDatas(100);
series.data.setAll(data);
sbSeries.data.setAll(data);

// Make stuff animate on load
// https://www.amcharts.com/docs/v5/concepts/animations/
series.appear(1000);
chart.appear(1000, 100);

}); // end am5.ready()
</script>

<!-- HTML -->
<div id="chartdiv"></div>