Pyramid Chart
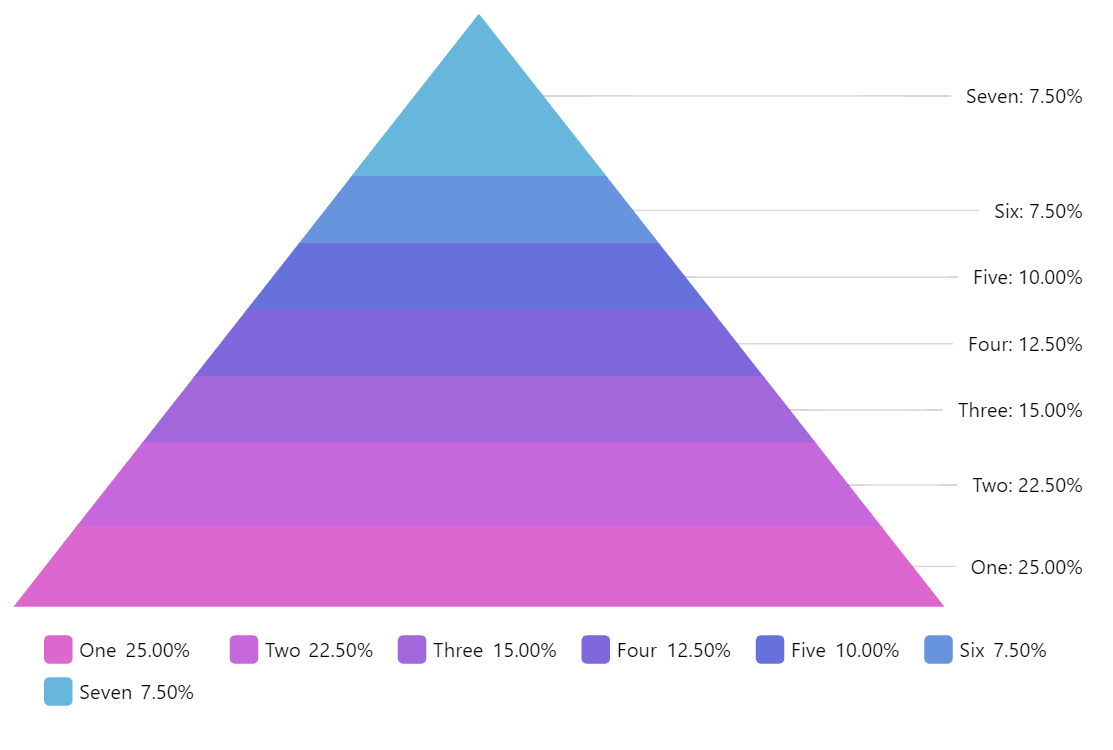
Pyramid Chart represents a single data series with values displayed as parts of a whole in a triangular shape. Due to its shape, it is often used to display hierarchically related data items. Conceptually, Pyramid chart is the inverse version of a Funnel chart.
Related tutorials
Demo source
<!-- Styles -->
<style>
#chartdiv {
width: 100%;
height: 500px;
}
</style>
<!-- Resources -->
<script src="https://cdn.amcharts.com/lib/5/index.js"></script>
<script src="https://cdn.amcharts.com/lib/5/percent.js"></script>
<script src="https://cdn.amcharts.com/lib/5/themes/Animated.js"></script>
<!-- Chart code -->
<script>
am5.ready(function() {
// Create root element
// https://www.amcharts.com/docs/v5/getting-started/#Root_element
var root = am5.Root.new("chartdiv");
// Set themes
// https://www.amcharts.com/docs/v5/concepts/themes/
root.setThemes([
am5themes_Animated.new(root)
]);
// Create chart
// https://www.amcharts.com/docs/v5/charts/percent-charts/sliced-chart/
var chart = root.container.children.push(am5percent.SlicedChart.new(root, {
layout: root.verticalLayout
}));
// Create series
// https://www.amcharts.com/docs/v5/charts/percent-charts/sliced-chart/#Series
var series = chart.series.push(am5percent.PyramidSeries.new(root, {
orientation: "vertical",
valueField: "value",
categoryField: "category"
}));
// Set data
// https://www.amcharts.com/docs/v5/charts/percent-charts/sliced-chart/#Setting_data
series.data.setAll([
{ value: 10, category: "One" },
{ value: 9, category: "Two" },
{ value: 6, category: "Three" },
{ value: 5, category: "Four" },
{ value: 4, category: "Five" },
{ value: 3, category: "Six" },
{ value: 3, category: "Seven" }
].reverse());
// Play initial series animation
// https://www.amcharts.com/docs/v5/concepts/animations/#Animation_of_series
series.appear();
// Create legend
// https://www.amcharts.com/docs/v5/charts/percent-charts/legend-percent-series/
var legend = chart.children.push(am5.Legend.new(root, {
centerX: am5.percent(50),
x: am5.percent(50),
marginTop: 15,
marginBottom: 15
}));
legend.data.setAll(am5.array.copy(series.dataItems).reverse());
// Make stuff animate on load
// https://www.amcharts.com/docs/v5/concepts/animations/
chart.appear(1000, 100);
}); // end am5.ready()
</script>
<!-- HTML -->
<div id="chartdiv"></div>