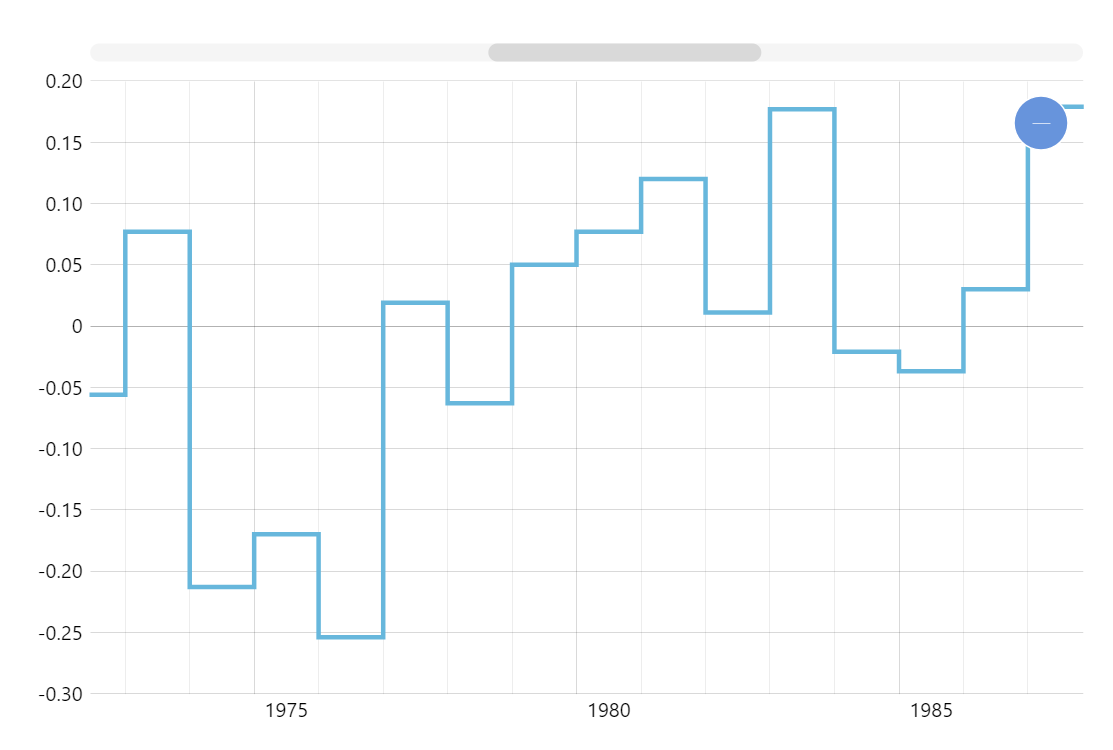
Step Line Chart
Step Line Chart (also known as Step Chart, Stepped Line Chart) is useful when you want to show changes happening at specific points. In contrast to Line Chart, which connects data points with the shortest possible line thus creating an appearance of values changing gradually, Step Line Chart highlights that values change discretely at specific points.
Related tutorials
Demo source
<!-- Styles -->
<style>
#chartdiv {
  width: 100%;
  height: 500px;
}
</style>

<!-- Resources -->
<script src="https://cdn.amcharts.com/lib/5/index.js"></script>
<script src="https://cdn.amcharts.com/lib/5/xy.js"></script>
<script src="https://cdn.amcharts.com/lib/5/themes/Animated.js"></script>

<!-- Chart code -->
<script>
am5.ready(function() {


// Create root element
// https://www.amcharts.com/docs/v5/getting-started/#Root_element
var root = am5.Root.new("chartdiv");

root.dateFormatter.setAll({
  dateFormat: "yyyy",
  dateFields: ["valueX"]
});


// Set themes
// https://www.amcharts.com/docs/v5/concepts/themes/
root.setThemes([
  am5themes_Animated.new(root)
]);


// Create chart
// https://www.amcharts.com/docs/v5/charts/xy-chart/
var chart = root.container.children.push(am5xy.XYChart.new(root, {
  panX: true,
  panY: true,
  wheelX: "panX",
  wheelY: "zoomX",
  pinchZoomX:true
}));


// Add cursor
// https://www.amcharts.com/docs/v5/charts/xy-chart/cursor/
var cursor = chart.set("cursor", am5xy.XYCursor.new(root, {
  behavior: "none"
}));
cursor.lineY.set("visible", false);


// Data
var data = [
  { year: "1950", value: -0.307 },
  { year: "1951", value: -0.168 },
  { year: "1952", value: -0.073 },
  { year: "1953", value: -0.027 },
  { year: "1954", value: -0.251 },
  { year: "1955", value: -0.281 },
  { year: "1956", value: -0.348 },
  { year: "1957", value: -0.074 },
  { year: "1958", value: -0.011 },
  { year: "1959", value: -0.074 },
  { year: "1960", value: -0.124 },
  { year: "1961", value: -0.024 },
  { year: "1962", value: -0.022 },
  { year: "1963", value: 0 },
  { year: "1964", value: -0.296 },
  { year: "1965", value: -0.217 },
  { year: "1966", value: -0.147 },
  { year: "1967", value: -0.15 },
  { year: "1968", value: -0.16 },
  { year: "1969", value: -0.011 },
  { year: "1970", value: -0.068 },
  { year: "1971", value: -0.19 },
  { year: "1972", value: -0.056 },
  { year: "1973", value: 0.077 },
  { year: "1974", value: -0.213 },
  { year: "1975", value: -0.17 },
  { year: "1976", value: -0.254 },
  { year: "1977", value: 0.019 },
  { year: "1978", value: -0.063 },
  { year: "1979", value: 0.05 },
  { year: "1980", value: 0.077 },
  { year: "1981", value: 0.12 },
  { year: "1982", value: 0.011 },
  { year: "1983", value: 0.177 },
  { year: "1984", value: -0.021 },
  { year: "1985", value: -0.037 },
  { year: "1986", value: 0.03 },
  { year: "1987", value: 0.179 },
  { year: "1988", value: 0.18 },
  { year: "1989", value: 0.104 },
  { year: "1990", value: 0.255 },
  { year: "1991", value: 0.21 },
  { year: "1992", value: 0.065 },
  { year: "1993", value: 0.11 },
  { year: "1994", value: 0.172 },
  { year: "1995", value: 0.269 },
  { year: "1996", value: 0.141 },
  { year: "1997", value: 0.353 },
  { year: "1998", value: 0.548 },
  { year: "1999", value: 0.298 },
  { year: "2000", value: 0.267 },
  { year: "2001", value: 0.411 },
  { year: "2002", value: 0.462 },
  { year: "2003", value: 0.47 },
  { year: "2004", value: 0.445 },
  { year: "2005", value: 0.47 }
];

// Create axes
// https://www.amcharts.com/docs/v5/charts/xy-chart/axes/
var xAxis = chart.xAxes.push(am5xy.DateAxis.new(root, {
  maxDeviation:0.5,
  baseInterval: { timeUnit: "year", count: 1 },
  renderer: am5xy.AxisRendererX.new(root, {pan:"zoom", minorGridEnabled: true}),
  tooltip: am5.Tooltip.new(root, {})
}));

var yAxis = chart.yAxes.push(am5xy.ValueAxis.new(root, {
  maxDeviation:1,
  renderer: am5xy.AxisRendererY.new(root, {pan:"zoom"})
}));

// Add series
// https://www.amcharts.com/docs/v5/charts/xy-chart/series/
var series = chart.series.push(am5xy.StepLineSeries.new(root, {
  xAxis: xAxis,
  yAxis: yAxis,
  valueYField: "value",
  valueXField: "year",
  tooltip: am5.Tooltip.new(root, {
    labelText: "{valueX}: {valueY}"
  })
}));

series.strokes.template.setAll({
  strokeWidth: 3
});


// Set up data processor to parse string dates
// https://www.amcharts.com/docs/v5/concepts/data/#Pre_processing_data
series.data.processor = am5.DataProcessor.new(root, {
  dateFormat: "yyyy",
  dateFields: ["year"]
});

series.data.setAll(data);


// Add scrollbar
// https://www.amcharts.com/docs/v5/charts/xy-chart/scrollbars/
chart.set("scrollbarX", am5.Scrollbar.new(root, {
  orientation: "horizontal"
}));


// Make stuff animate on load
// https://www.amcharts.com/docs/v5/concepts/animations/
series.appear(1000);
chart.appear(1000, 100);

}); // end am5.ready()
</script>

<!-- HTML -->
<div id="chartdiv"></div>