XY Chart with Fills to the Axis
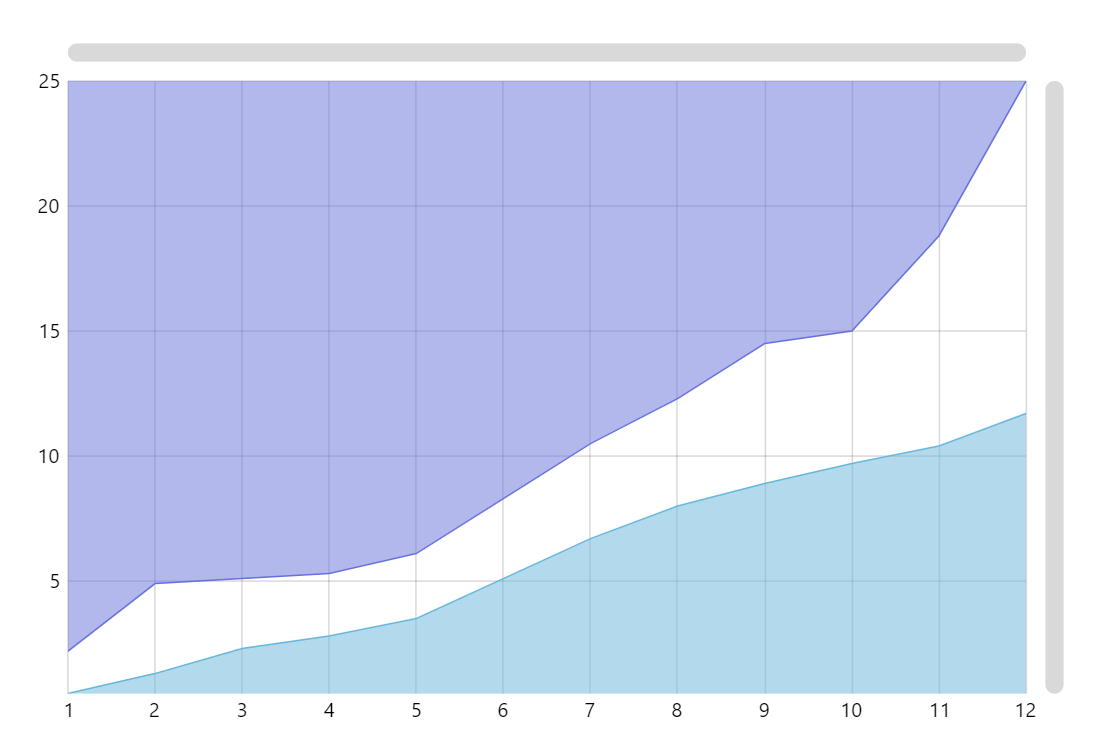
This demo shows how to create area chart series with fills going to different axes. As you can see, the fill of the lower series goes to the X axis, while the upper series is filled to the Y axis.
Key implementation details
To achieve this all we need to do is set baseAxis on the series. The series is then filled towards that axis.
Related tutorials
Demo source
<!-- Styles -->
<style>
#chartdiv {
  width: 100%;
  height: 500px;
}
</style>

<!-- Resources -->
<script src="https://cdn.amcharts.com/lib/5/index.js"></script>
<script src="https://cdn.amcharts.com/lib/5/xy.js"></script>
<script src="https://cdn.amcharts.com/lib/5/themes/Animated.js"></script>

<!-- Chart code -->
<script>
am5.ready(function() {

// Data
var data = [
  {
    ax: 1,
    ay: 0.5,
    bx: 1,
    by: 2.2
  },
  {
    ax: 2,
    ay: 1.3,
    bx: 2,
    by: 4.9
  },
  {
    ax: 3,
    ay: 2.3,
    bx: 3,
    by: 5.1
  },
  {
    ax: 4,
    ay: 2.8,
    bx: 4,
    by: 5.3
  },
  {
    ax: 5,
    ay: 3.5,
    bx: 5,
    by: 6.1
  },
  {
    ax: 6,
    ay: 5.1,
    bx: 6,
    by: 8.3
  },
  {
    ax: 7,
    ay: 6.7,
    bx: 7,
    by: 10.5
  },
  {
    ax: 8,
    ay: 8,
    bx: 8,
    by: 12.3
  },
  {
    ax: 9,
    ay: 8.9,
    bx: 9,
    by: 14.5
  },
  {
    ax: 10,
    ay: 9.7,
    bx: 10,
    by: 15
  },
  {
    ax: 11,
    ay: 10.4,
    bx: 11,
    by: 18.8
  },
  {
    ax: 12,
    ay: 11.7,
    bx: 12,
    by: 25
  }
];

// Create root element
// https://www.amcharts.com/docs/v5/getting-started/#Root_element
var root = am5.Root.new("chartdiv");

// Set themes
// https://www.amcharts.com/docs/v5/concepts/themes/
root.setThemes([
  am5themes_Animated.new(root)
]);

// Create chart
// https://www.amcharts.com/docs/v5/charts/xy-chart/
var chart = root.container.children.push(
  am5xy.XYChart.new(root, {
    panX: false,
    panY: false,
    wheelY: "none"
  })
);

chart.get("colors").set("step", 2);

// Create axes
// https://www.amcharts.com/docs/v5/charts/xy-chart/axes/
var xAxis = chart.xAxes.push(
  am5xy.ValueAxis.new(root, {
    strictMinMax: true,
    maxDeviation: 0,
    renderer: am5xy.AxisRendererX.new(root, { minGridDistance: 50 }),
    tooltip: am5.Tooltip.new(root, {
      themeTags: ["axis"],
      animationDuration: 300
    })
  })
);

var yAxis = chart.yAxes.push(
  am5xy.ValueAxis.new(root, {
    strictMinMax: true,
    maxDeviation: 0,
    renderer: am5xy.AxisRendererY.new(root, {}),
    tooltip: am5.Tooltip.new(root, {
      themeTags: ["axis"],
      animationDuration: 300
    })
  })
);

// Create series
// https://www.amcharts.com/docs/v5/charts/xy-chart/series/
var series0 = chart.series.push(
  am5xy.LineSeries.new(root, {
    xAxis: xAxis,
    yAxis: yAxis,
    valueYField: "ay",
    valueXField: "ax",
    baseAxis: xAxis,
    tooltip: am5.Tooltip.new(root, {
      labelText: "x:{valueX}, y:{valueY}"
    })
  })
);

series0.fills.template.setAll({
  fillOpacity: 0.5,
  visible: true
});

// Create series
// https://www.amcharts.com/docs/v5/charts/xy-chart/series/
var series1 = chart.series.push(
  am5xy.LineSeries.new(root, {
    xAxis: xAxis,
    yAxis: yAxis,
    valueYField: "by",
    valueXField: "bx",
    baseAxis: yAxis,
    tooltip: am5.Tooltip.new(root, {
      labelText: "x:{valueX}, y:{valueY}"
    })
  })
);

series1.fills.template.setAll({
  fillOpacity: 0.5,
  visible: true
});

// Add cursor
// https://www.amcharts.com/docs/v5/charts/xy-chart/cursor/
chart.set("cursor", am5xy.XYCursor.new(root, {
  xAxis: xAxis,
  yAxis: yAxis,
  snapToSeries: [series0, series1]
}));

// Add scrollbars
// https://www.amcharts.com/docs/v5/charts/xy-chart/scrollbars/
chart.set("scrollbarX", am5.Scrollbar.new(root, {
  orientation: "horizontal"
}));

chart.set("scrollbarY", am5.Scrollbar.new(root, {
  orientation: "vertical"
}));

series0.data.setAll(data);
series1.data.setAll(data);

// Make stuff animate on load
// https://www.amcharts.com/docs/v5/concepts/animations/
series0.appear(1000);
series1.appear(1000);
chart.appear(1000, 100);

}); // end am5.ready()
</script>

<!-- HTML -->
<div id="chartdiv"></div>