Stacked Bar Chart
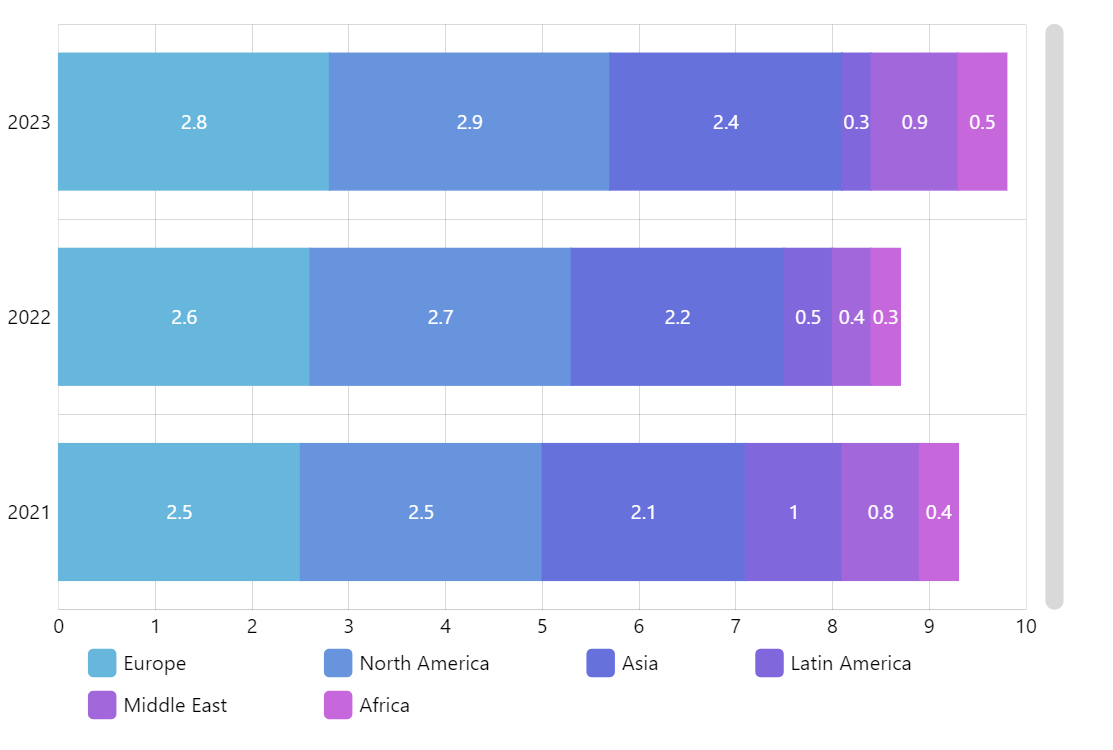
Stacked bar charts are useful to demonstrate how a larger data category is comprised of smaller categories, and what part each of the smaller categories plays in the total of a larger one.
Key implementation details
We set yAxis to be a CategoryAxis and xAxis to a ValueAxis. Accordingly, we set valueXField and categoryYField properties on the series, so they know that categories go along the Y axis and values along the X.
Additionally, we add a vertical scrollbar.
Related tutorials
Demo source