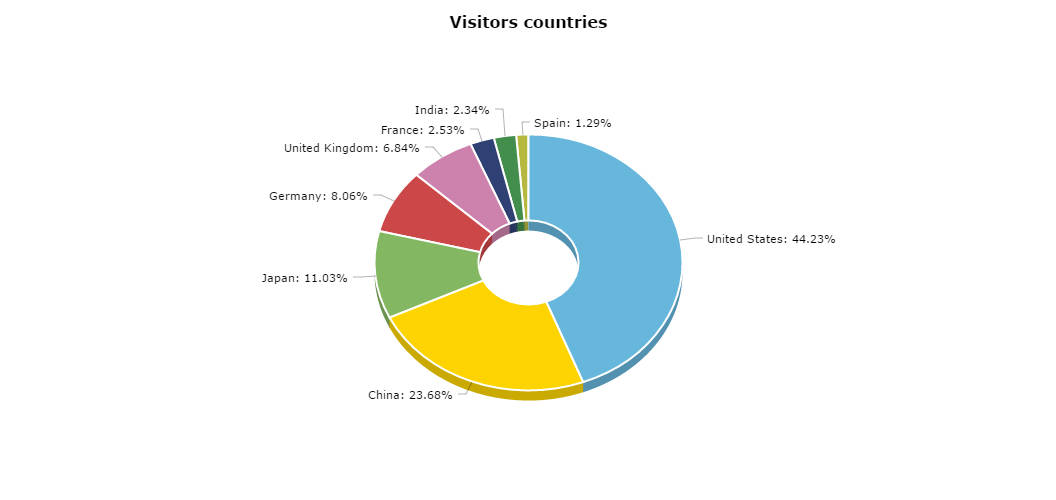
3D Donut Chart
Donut chart is a simple pie chart with a hole inside. You can define the size of the hole both in pixels and percent.
Demo source
<!-- Styles -->
<style>
#chartdiv {
  width: 100%;
  height: 500px;
}
</style>

<!-- Resources -->
<script src="https://www.amcharts.com/lib/3/amcharts.js"></script>
<script src="https://www.amcharts.com/lib/3/pie.js"></script>
<script src="https://www.amcharts.com/lib/3/plugins/export/export.min.js"></script>
<link rel="stylesheet" href="https://www.amcharts.com/lib/3/plugins/export/export.css" type="text/css" media="all" />

<!-- Chart code -->
<script>
var chart = AmCharts.makeChart( "chartdiv", {
  "type": "pie",
  "theme": "none",
  "titles": [ {
    "text": "Visitors countries",
    "size": 16
  } ],
  "dataProvider": [ {
    "country": "United States",
    "visits": 7252
  }, {
    "country": "China",
    "visits": 3882
  }, {
    "country": "Japan",
    "visits": 1809
  }, {
    "country": "Germany",
    "visits": 1322
  }, {
    "country": "United Kingdom",
    "visits": 1122
  }, {
    "country": "France",
    "visits": 414
  }, {
    "country": "India",
    "visits": 384
  }, {
    "country": "Spain",
    "visits": 211
  } ],
  "valueField": "visits",
  "titleField": "country",
  "startEffect": "elastic",
  "startDuration": 2,
  "labelRadius": 15,
  "innerRadius": "50%",
  "depth3D": 10,
  "balloonText": "[[title]]<br><span style='font-size:14px'><b>[[value]]</b> ([[percents]]%)</span>",
  "angle": 15,
  "export": {
    "enabled": true
  }
} );
</script>

<!-- HTML -->
<div id="chartdiv"></div>