Polar Chart
Polar Chart is a variation of Radar Chart where points are placed in the polar coordinate system and values represent the distance from the pole (center).
Key implementation details
In terms of implementation, there’s nothing specifically different from creating a Radar Chart. What makes it a Polar Chart is that we use polar coordinate system (directions) as categories for our circular X axis.
Related tutorials
Build this chart with AI
The prompt below can be used to build this chart with AI. For best coding results, use the most advanced AI models, like Claude Opus 4.6 and GPT-5.3-Codex. For more info and tips, check out amCharts AI docs.
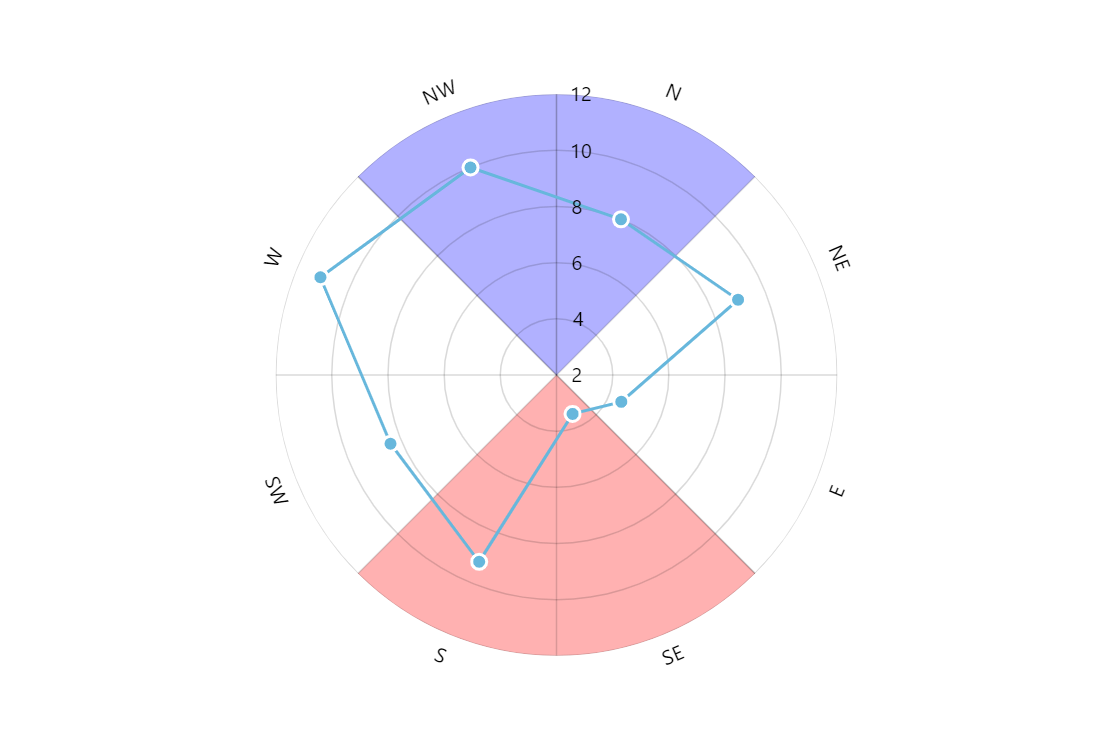
Create a polar chart where data points are placed in a polar coordinate system with distance from the center representing values. Display 8 compass directions (N, NE, E, SE, S, SW, W, NW) on a circular category axis with outward labels. Plot a line series connecting data points (values ranging from 3.5 to 11.1) with circular bullet markers at each point. Add colored reference zones with partial transparency: blue highlighting covering the NW/N sectors and red highlighting the SE/S sectors. Configure tooltips showing the direction and value. Disable panning; enable mouse wheel for zooming. Animate series on load. Use amCharts 5 library.
Demo source