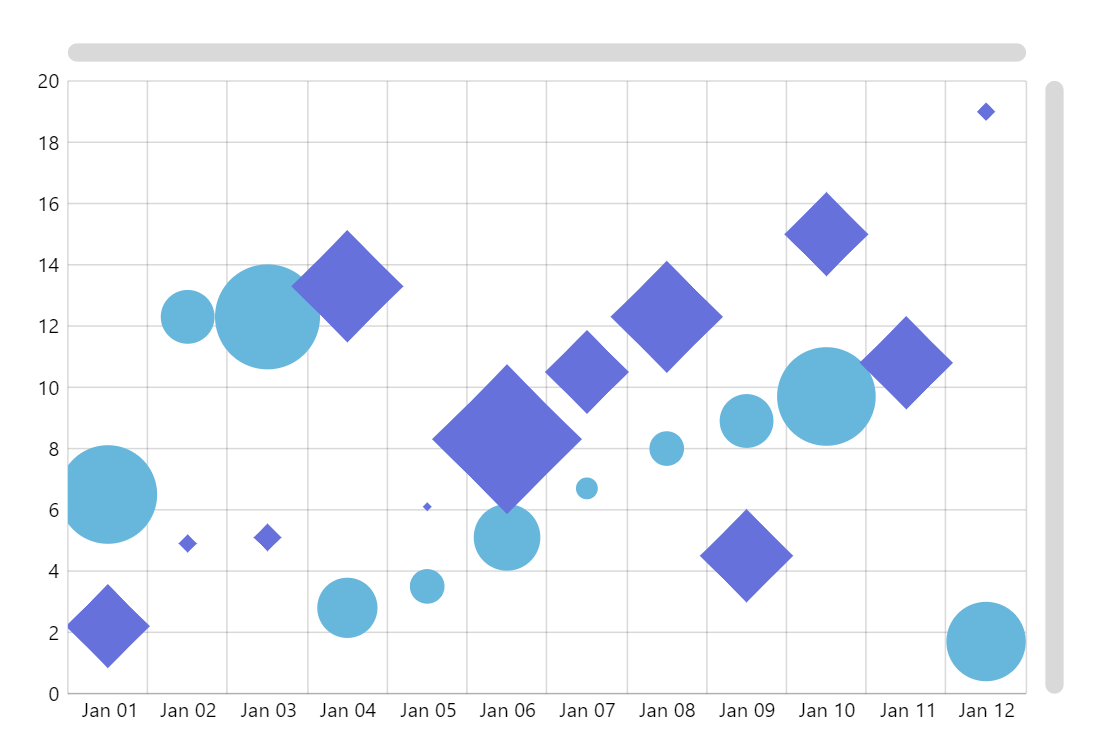
XY Chart with Date-Based Axis
In addition to category and value axes, XYChart supports date axes. This enables various date-specific formatting and layout scenarios.
Implementation details
We add a new DateAxis to the chart’s xAxes. We also specify dateFormat in the series data processor to configure how the dates are formatted in our data.
Related tutorials
Demo source
<!-- Styles -->
<style>
body {
  font-family: -apple-system, BlinkMacSystemFont, "Segoe UI", Roboto, Helvetica, Arial, sans-serif, "Apple Color Emoji", "Segoe UI Emoji", "Segoe UI Symbol";
}

#chartdiv {
  width: 100%;
  height: 500px;
}
</style>

<!-- Resources -->
<script src="https://cdn.amcharts.com/lib/5/index.js"></script>
<script src="https://cdn.amcharts.com/lib/5/xy.js"></script>
<script src="https://cdn.amcharts.com/lib/5/themes/Animated.js"></script>

<!-- Chart code -->
<script>
am5.ready(function() {

// Create root element
// https://www.amcharts.com/docs/v5/getting-started/#Root_element
var root = am5.Root.new("chartdiv");

// Set themes
// https://www.amcharts.com/docs/v5/concepts/themes/
root.setThemes([
  am5themes_Animated.new(root)
]);

root.dateFormatter.setAll({
  dateFormat: "yyyy-MM-dd",
  dateFields: ["valueX"]
});

// Create chart
// https://www.amcharts.com/docs/v5/charts/xy-chart/
var chart = root.container.children.push(am5xy.XYChart.new(root, {
  panX: false,
  panY: false,
  wheelY: "zoomXY"
}));

chart.get("colors").set("step", 2);

// Create axes
// https://www.amcharts.com/docs/v5/charts/xy-chart/axes/
var xAxis = chart.xAxes.push(am5xy.DateAxis.new(root, {
  baseInterval: { timeUnit: "day", count: 1 },
  autoZoom: false,
  renderer: am5xy.AxisRendererX.new(root, {
    minGridDistance: 50,
    minorGridEnabled:true
  }),
  tooltip: am5.Tooltip.new(root, {})
}));

var yAxis = chart.yAxes.push(am5xy.ValueAxis.new(root, {
  renderer: am5xy.AxisRendererY.new(root, {}),
  autoZoom: false,
  tooltip: am5.Tooltip.new(root, {})
}));

// Create series
// https://www.amcharts.com/docs/v5/charts/xy-chart/series/
var series0 = chart.series.push(am5xy.LineSeries.new(root, {
  calculateAggregates: true,
  xAxis: xAxis,
  yAxis: yAxis,
  valueYField: "ay",
  valueXField: "date",
  valueField: "aValue",
  tooltip: am5.Tooltip.new(root, {
    labelText: "{valueX}, y: {valueY}, value: {value}"
  })
}));


// Add bullet
// https://www.amcharts.com/docs/v5/charts/xy-chart/series/#Bullets
var circleTemplate = am5.Template.new({});
series0.bullets.push(function() {
  var graphics = am5.Circle.new(root, {
    fill: series0.get("fill"),
  }, circleTemplate);
  return am5.Bullet.new(root, {
    sprite: graphics
  });
});

// Add heat rule
// https://www.amcharts.com/docs/v5/concepts/settings/heat-rules/
series0.set("heatRules", [{
  target: circleTemplate,
  min: 3,
  max: 35,
  dataField: "value",
  key: "radius"
}]);


var starTemplate = am5.Template.new({});
// Create second series
// https://www.amcharts.com/docs/v5/charts/xy-chart/series/
var series1 = chart.series.push(am5xy.LineSeries.new(root, {
  calculateAggregates: true,
  xAxis: xAxis,
  yAxis: yAxis,
  valueYField: "by",
  valueXField: "date",
  valueField: "bValue",
  tooltip: am5.Tooltip.new(root, {
    labelText: "{valueX}, y: {valueY}, value: {value}"
  })
}));

// Add bullet
// https://www.amcharts.com/docs/v5/charts/xy-chart/series/#Bullets
series1.bullets.push(function() {
  var graphics = am5.Star.new(root, {
    fill: series1.get("fill"),
    spikes: 4,
    innerRadius: am5.percent(70),
  }, starTemplate);
  return am5.Bullet.new(root, {
    sprite: graphics
  });
});


// Add heat rule
// https://www.amcharts.com/docs/v5/concepts/settings/heat-rules/
series1.set("heatRules", [{
  target: starTemplate,
  min: 3,
  max: 50,
  dataField: "value",
  key: "radius"
}]);


series0.strokes.template.set("strokeOpacity", 0);
series1.strokes.template.set("strokeOpacity", 0);

series0.data.processor = am5.DataProcessor.new(root, {
  dateFields: ["date"], dateFormat: "yyyy-MM-dd"
});

series1.data.processor = am5.DataProcessor.new(root, {
  dateFields: ["date"], dateFormat: "yyyy-MM-dd"
});

// Add cursor
// https://www.amcharts.com/docs/v5/charts/xy-chart/cursor/
chart.set("cursor", am5xy.XYCursor.new(root, {
  xAxis: xAxis,
  yAxis: yAxis,
  behavior: "zoomXY",
  snapToSeries: [series0, series1]
}));

// Add scrollbars
// https://www.amcharts.com/docs/v5/charts/xy-chart/scrollbars/
chart.set("scrollbarX", am5.Scrollbar.new(root, {
  orientation: "horizontal"
}));

chart.set("scrollbarY", am5.Scrollbar.new(root, {
  orientation: "vertical"
}));


var data = [{
  "date": "2015-01-01",
  "ay": 6.5,
  "by": 2.2,
  "aValue": 15,
  "bValue": 10
}, {
  "date": "2015-01-02",
  "ay": 12.3,
  "by": 4.9,
  "aValue": 8,
  "bValue": 3
}, {
  "date": "2015-01-03",
  "ay": 12.3,
  "by": 5.1,
  "aValue": 16,
  "bValue": 4
}, {
  "date": "2015-01-04",
  "ay": 2.8,
  "by": 13.3,
  "aValue": 9,
  "bValue": 13
}, {
  "date": "2015-01-05",
  "ay": 3.5,
  "by": 6.1,
  "aValue": 5,
  "bValue": 2
}, {
  "date": "2015-01-06",
  "ay": 5.1,
  "by": 8.3,
  "aValue": 10,
  "bValue": 17
}, {
  "date": "2015-01-07",
  "ay": 6.7,
  "by": 10.5,
  "aValue": 3,
  "bValue": 10
}, {
  "date": "2015-01-08",
  "ay": 8,
  "by": 12.3,
  "aValue": 5,
  "bValue": 13
}, {
  "date": "2015-01-09",
  "ay": 8.9,
  "by": 4.5,
  "aValue": 8,
  "bValue": 11
}, {
  "date": "2015-01-10",
  "ay": 9.7,
  "by": 15,
  "aValue": 15,
  "bValue": 10
}, {
  "date": "2015-01-11",
  "ay": 10.4,
  "by": 10.8,
  "aValue": 1,
  "bValue": 11
}, {
  "date": "2015-01-12",
  "ay": 1.7,
  "by": 19,
  "aValue": 12,
  "bValue": 3
}]

series0.data.setAll(data);
series1.data.setAll(data);


// Make stuff animate on load
// https://www.amcharts.com/docs/v5/concepts/animations/
series0.appear(1000);
series1.appear(1000);

chart.appear(1000, 100);

}); // end am5.ready()
</script>

<!-- HTML -->
<div id="chartdiv"></div>