DataViz Tip #12: Show Up to Four Lines in a Line Chart
A good rule of thumb is to limit the number of lines shown in a line chart to 3 or 4. Above that the picture gets messy quite fast:
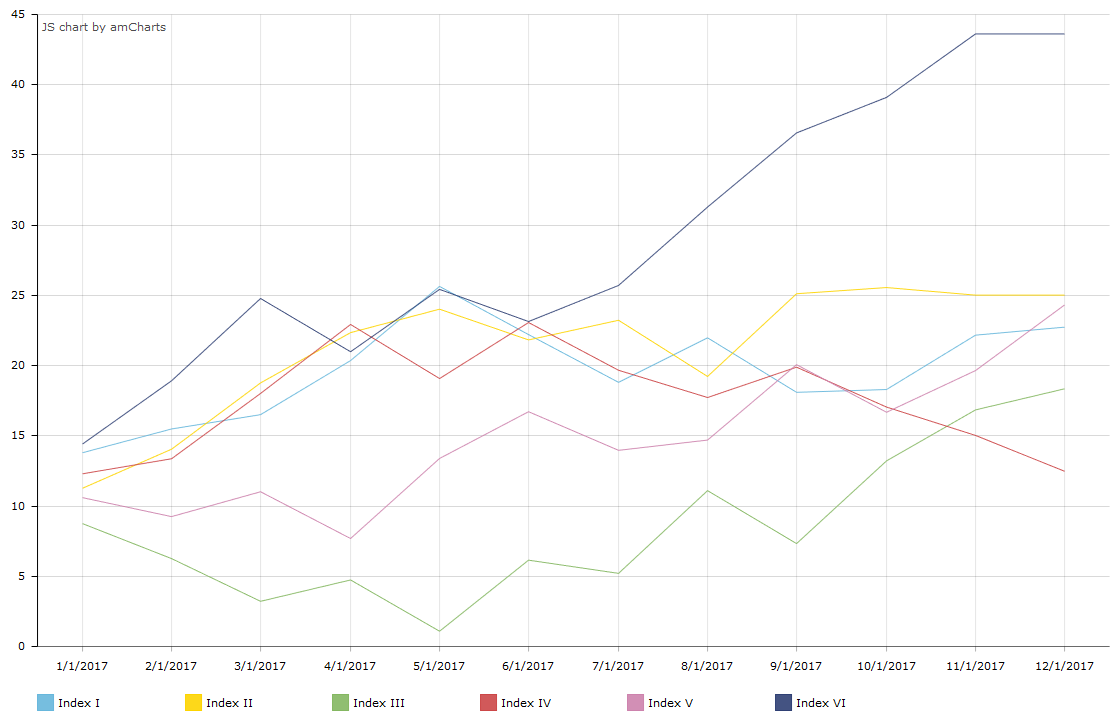
When you need to show more than 3-4 lines consider using a different chart type or a panel of “micro charts” instead.
Having said that, when using an interactive charting library like amCharts, you can have more series in the same chart while showing just the 3-4 most important ones initially and letting the viewer decide if they want to switch other lines on or off.
Just set "hidden": true on the graphs you don’t want to be displayed when the chart loads:
[codepen_embed height=”434″ theme_id=”24419″ slug_hash=”2b3215c1ebd09ab14f15e541b78fabc7″ default_tab=”result” user=”amcharts”]See the Pen <a href=’https://codepen.io/team/amcharts/pen/2b3215c1ebd09ab14f15e541b78fabc7/’>dataviz-tip-012-3-on</a> by amCharts (<a href=’https://codepen.io/amcharts’>@amcharts</a>) on <a href=’https://codepen.io’>CodePen</a>.[/codepen_embed]