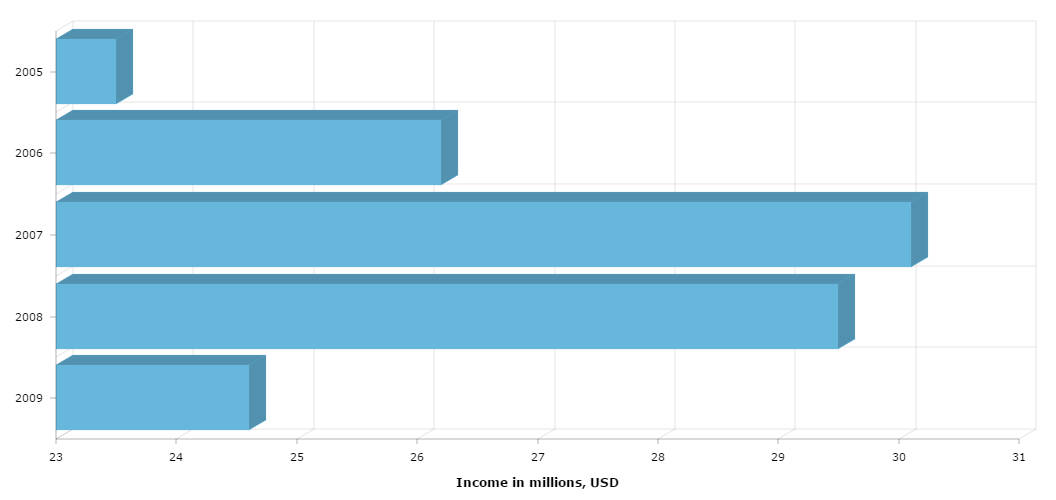
3D Bar Chart
Columns and bars in our charts can have a 3D look. You can adjust depth and angle to make them more deep – click EDIT button and play with depth3D and angle properties.
Demo source
<!-- Styles -->
<style>
#chartdiv {
  width: 100%;
  height: 500px;
}
</style>

<!-- Resources -->
<script src="https://www.amcharts.com/lib/3/amcharts.js"></script>
<script src="https://www.amcharts.com/lib/3/serial.js"></script>
<script src="https://www.amcharts.com/lib/3/plugins/export/export.min.js"></script>
<link rel="stylesheet" href="https://www.amcharts.com/lib/3/plugins/export/export.css" type="text/css" media="all" />

<!-- Chart code -->
<script>
var chart = AmCharts.makeChart("chartdiv", {
    "theme": "none",
    "type": "serial",
    "dataProvider": [{
        "year": 2005,
        "income": 23.5
    }, {
        "year": 2006,
        "income": 26.2
    }, {
        "year": 2007,
        "income": 30.1
    }, {
        "year": 2008,
        "income": 29.5
    }, {
        "year": 2009,
        "income": 24.6
    }],
    "valueAxes": [{
        "title": "Income in millions, USD"
    }],
    "graphs": [{
        "balloonText": "Income in [[category]]:[[value]]",
        "fillAlphas": 1,
        "lineAlpha": 0.2,
        "title": "Income",
        "type": "column",
        "valueField": "income"
    }],
    "depth3D": 20,
    "angle": 30,
    "rotate": true,
    "categoryField": "year",
    "categoryAxis": {
        "gridPosition": "start",
        "fillAlpha": 0.05,
        "position": "left"
    },
    "export": {
    	"enabled": true
     }
});
</script>

<!-- HTML -->
<div id="chartdiv"></div>