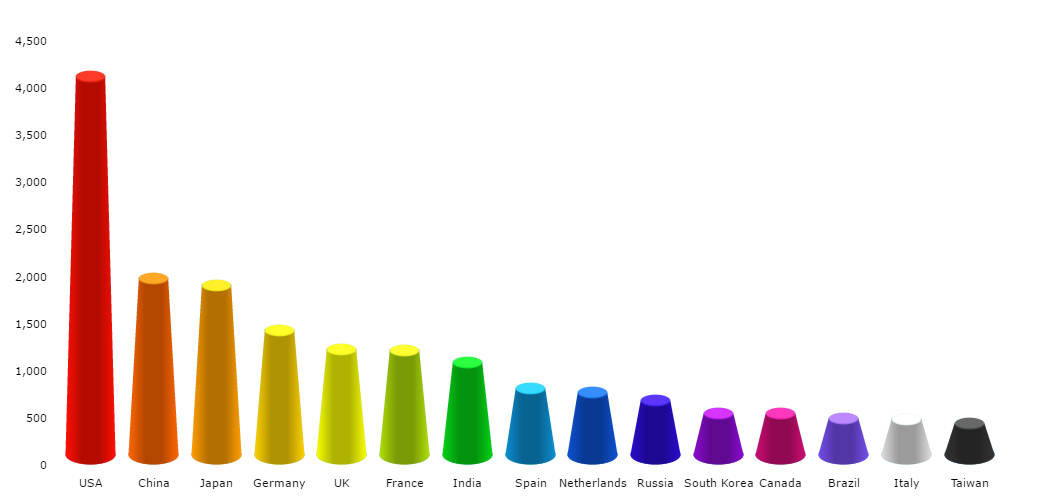
3D Cylinder Chart
Columns and bars in our charts can look like cylinders or even cones. To achieve this, you should set topRadiusproperty of a graph to 0 – 1.5 value. You can adjust depth and angle to make them more deep – click EDIT button and play with depth3D and angle properties.
Demo source
<!-- Styles -->
<style>
#chartdiv {
  width: 100%;
  height: 500px;
}
</style>

<!-- Resources -->
<script src="https://www.amcharts.com/lib/3/amcharts.js"></script>
<script src="https://www.amcharts.com/lib/3/serial.js"></script>
<script src="https://www.amcharts.com/lib/3/plugins/export/export.min.js"></script>
<link rel="stylesheet" href="https://www.amcharts.com/lib/3/plugins/export/export.css" type="text/css" media="all" />

<!-- Chart code -->
<script>
var chart = AmCharts.makeChart("chartdiv", {
    "theme": "none",
    "type": "serial",
    "startDuration": 2,
    "dataProvider": [{
        "country": "USA",
        "visits": 4025,
        "color": "#FF0F00"
    }, {
        "country": "China",
        "visits": 1882,
        "color": "#FF6600"
    }, {
        "country": "Japan",
        "visits": 1809,
        "color": "#FF9E01"
    }, {
        "country": "Germany",
        "visits": 1322,
        "color": "#FCD202"
    }, {
        "country": "UK",
        "visits": 1122,
        "color": "#F8FF01"
    }, {
        "country": "France",
        "visits": 1114,
        "color": "#B0DE09"
    }, {
        "country": "India",
        "visits": 984,
        "color": "#04D215"
    }, {
        "country": "Spain",
        "visits": 711,
        "color": "#0D8ECF"
    }, {
        "country": "Netherlands",
        "visits": 665,
        "color": "#0D52D1"
    }, {
        "country": "Russia",
        "visits": 580,
        "color": "#2A0CD0"
    }, {
        "country": "South Korea",
        "visits": 443,
        "color": "#8A0CCF"
    }, {
        "country": "Canada",
        "visits": 441,
        "color": "#CD0D74"
    }, {
        "country": "Brazil",
        "visits": 395,
        "color": "#754DEB"
    }, {
        "country": "Italy",
        "visits": 386,
        "color": "#DDDDDD"
    }, {
        "country": "Taiwan",
        "visits": 338,
        "color": "#333333"
    }],
    "valueAxes": [{
        "position": "left",
        "axisAlpha":0,
        "gridAlpha":0
    }],
    "graphs": [{
        "balloonText": "[[category]]: <b>[[value]]</b>",
        "colorField": "color",
        "fillAlphas": 0.85,
        "lineAlpha": 0.1,
        "type": "column",
        "topRadius":1,
        "valueField": "visits"
    }],
    "depth3D": 40,
	"angle": 30,
    "chartCursor": {
        "categoryBalloonEnabled": false,
        "cursorAlpha": 0,
        "zoomable": false
    },
    "categoryField": "country",
    "categoryAxis": {
        "gridPosition": "start",
        "axisAlpha":0,
        "gridAlpha":0

    },
    "export": {
    	"enabled": true
     }

}, 0);
</script>

<!-- HTML -->
<div id="chartdiv"></div>