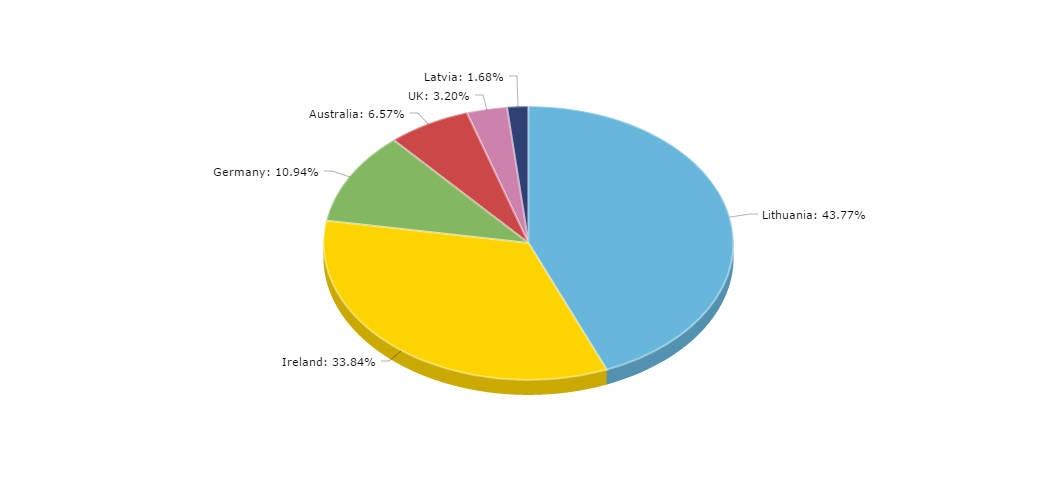
3D Pie Chart
As a lot of people like 3D pie charts, our pie chart can have 3D look. To do this, you have to add two properties to the chart’s config: depth3D and angle. Although you must know, that flat pie charts will represent data better than 3D ones.
Demo source
<!-- Styles -->
<style>
#chartdiv {
  width: 100%;
  height: 500px;
}
</style>

<!-- Resources -->
<script src="https://www.amcharts.com/lib/3/amcharts.js"></script>
<script src="https://www.amcharts.com/lib/3/pie.js"></script>
<script src="https://www.amcharts.com/lib/3/plugins/export/export.min.js"></script>
<link rel="stylesheet" href="https://www.amcharts.com/lib/3/plugins/export/export.css" type="text/css" media="all" />

<!-- Chart code -->
<script>
var chart = AmCharts.makeChart( "chartdiv", {
  "type": "pie",
  "theme": "none",
  "dataProvider": [ {
    "country": "Lithuania",
    "value": 260
  }, {
    "country": "Ireland",
    "value": 201
  }, {
    "country": "Germany",
    "value": 65
  }, {
    "country": "Australia",
    "value": 39
  }, {
    "country": "UK",
    "value": 19
  }, {
    "country": "Latvia",
    "value": 10
  } ],
  "valueField": "value",
  "titleField": "country",
  "outlineAlpha": 0.4,
  "depth3D": 15,
  "balloonText": "[[title]]<br><span style='font-size:14px'><b>[[value]]</b> ([[percents]]%)</span>",
  "angle": 30,
  "export": {
    "enabled": true
  }
} );
</script>

<!-- HTML -->
<div id="chartdiv"></div>