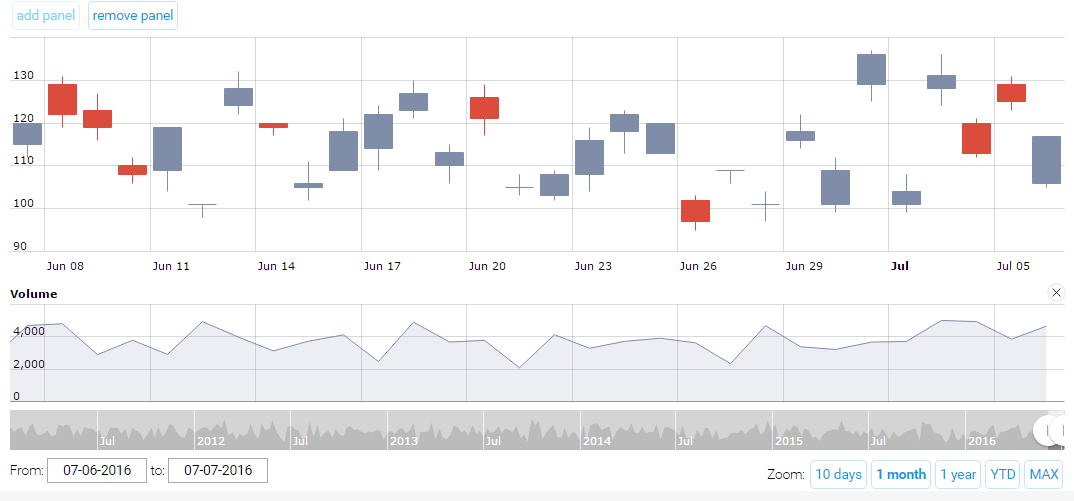
Adding and removing panel
Our Stock chart can support any number of panels and you can even add them at a run time. Click on “add panel” button – a second panel will appear in the bottom of the chart. You can remove it by clicking on “remove panel” button or on the X icon next to panel. You can use this feature to add panels with technical indicators or other technical analysis tools.
Demo source
<!-- Styles -->
<style>
#chartdiv {
  width: 100%;
  height: 450px;
}
</style>

<!-- Resources -->
<script src="https://www.amcharts.com/lib/3/amcharts.js"></script>
<script src="https://www.amcharts.com/lib/3/serial.js"></script>
<script src="https://www.amcharts.com/lib/3/amstock.js"></script>
<script src="https://www.amcharts.com/lib/3/plugins/export/export.min.js"></script>
<link rel="stylesheet" href="https://www.amcharts.com/lib/3/plugins/export/export.css" type="text/css" media="all" />

<!-- Chart code -->
<script>
var chartData = [];

function generateChartData() {
  var firstDate = new Date();
  firstDate.setHours( 0, 0, 0, 0 );
  firstDate.setDate( firstDate.getDate() - 2000 );

  for ( var i = 0; i < 2000; i++ ) {
    var newDate = new Date( firstDate );

    newDate.setDate( newDate.getDate() + i );

    var open = Math.round( Math.random() * ( 30 ) + 100 );
    var close = open + Math.round( Math.random() * ( 15 ) - Math.random() * 10 );

    var low;
    if ( open < close ) {
      low = open - Math.round( Math.random() * 5 );
    } else {
      low = close - Math.round( Math.random() * 5 );
    }

    var high;
    if ( open < close ) {
      high = close + Math.round( Math.random() * 5 );
    } else {
      high = open + Math.round( Math.random() * 5 );
    }

    var volume = Math.round( Math.random() * ( 1000 + i ) ) + 100 + i;


    chartData[ i ] = ( {
      "date": newDate,
      "open": open,
      "close": close,
      "high": high,
      "low": low,
      "volume": volume
    } );
  }
}

generateChartData();

var chart = AmCharts.makeChart( "chartdiv", {
  "type": "stock",
  "theme": "none",
  "dataSets": [ {
    "fieldMappings": [ {
      "fromField": "open",
      "toField": "open"
    }, {
      "fromField": "close",
      "toField": "close"
    }, {
      "fromField": "high",
      "toField": "high"
    }, {
      "fromField": "low",
      "toField": "low"
    }, {
      "fromField": "volume",
      "toField": "volume"
    }, {
      "fromField": "value",
      "toField": "value"
    } ],
    "color": "#7f8da9",
    "dataProvider": chartData,
    "categoryField": "date"
  } ],
  "balloon": {
    "horizontalPadding": 13
  },
  "panels": [ {
    "title": "Value",
    "stockGraphs": [ {
      "id": "g1",
      "type": "candlestick",
      "openField": "open",
      "closeField": "close",
      "highField": "high",
      "lowField": "low",
      "valueField": "close",
      "lineColor": "#7f8da9",
      "fillColors": "#7f8da9",
      "negativeLineColor": "#db4c3c",
      "negativeFillColors": "#db4c3c",
      "fillAlphas": 1,
      "balloonText": "open:<b>[[open]]</b><br>close:<b>[[close]]</b><br>low:<b>[[low]]</b><br>high:<b>[[high]]</b>",
      "useDataSetColors": false
    } ]
  } ],
  "scrollBarSettings": {
    "graphType": "line",
    "usePeriod": "WW"
  },
  "panelsSettings": {
    "panEventsEnabled": true
  },
  "cursorSettings": {
    "valueBalloonsEnabled": true,
    "valueLineBalloonEnabled": true,
    "valueLineEnabled": true
  },
  "periodSelector": {
    "position": "bottom",
    "periods": [ {
      "period": "DD",
      "count": 10,
      "label": "10 days"
    }, {
      "period": "MM",
      "selected": true,
      "count": 1,
      "label": "1 month"
    }, {
      "period": "YYYY",
      "count": 1,
      "label": "1 year"
    }, {
      "period": "YTD",
      "label": "YTD"
    }, {
      "period": "MAX",
      "label": "MAX"
    } ]
  }
} );

function addPanel() {
  var chart = AmCharts.charts[ 0 ];
  if ( chart.panels.length == 1 ) {
    var newPanel = new AmCharts.StockPanel();
    newPanel.allowTurningOff = true;
    newPanel.title = "Volume";
    newPanel.showCategoryAxis = false;

    var graph = new AmCharts.StockGraph();
    graph.valueField = "volume";
    graph.fillAlphas = 0.15;
    newPanel.addStockGraph( graph );

    var legend = new AmCharts.StockLegend();
    legend.markerType = "none";
    legend.markerSize = 0;
    newPanel.stockLegend = legend;

    chart.addPanelAt( newPanel, 1 );
    chart.validateNow();
  }
}

function removePanel() {
  var chart = AmCharts.charts[ 0 ];
  if ( chart.panels.length > 1 ) {
    chart.removePanel( chart.panels[ 1 ] );
    chart.validateNow();
  }
}
</script>

<!-- HTML -->
<div style="padding-bottom: 5px;">
<input type="button" class="amChartsButton" id="addPanelButton" value="add panel" onclick="addPanel();">
<input type="button" class="amChartsButton" id="removePanelButton" value="remove panel" onclick="removePanel();">
</div>
<div id="chartdiv"></div>