Angular Gauge
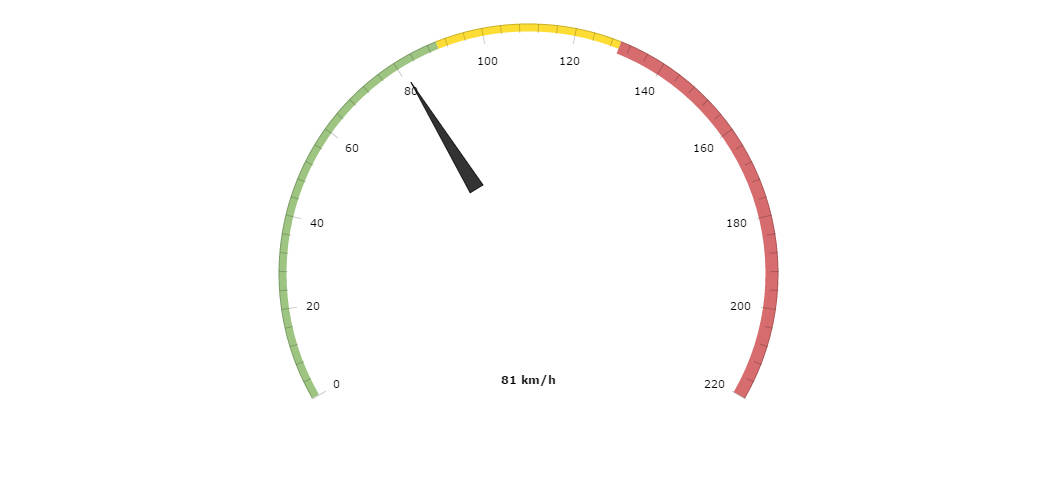
Angular Gauge, or Speedometer chart is mostly used to show data which is shown using similar gauges in real life, like speed, volume equalizer, clock, etc. Our Angular Gauge chart can display multiple axes, multiple arrows, also show color bands on the axis.
Demo source
<!-- Styles -->
<style>
#chartdiv {
	width	: 100%;
	height	: 500px;
}
</style>

<!-- Resources -->
<script src="https://www.amcharts.com/lib/3/amcharts.js"></script>
<script src="https://www.amcharts.com/lib/3/gauge.js"></script>
<script src="https://www.amcharts.com/lib/3/plugins/export/export.min.js"></script>
<link rel="stylesheet" href="https://www.amcharts.com/lib/3/plugins/export/export.css" type="text/css" media="all" />

<!-- Chart code -->
<script>
var gaugeChart = AmCharts.makeChart( "chartdiv", {
  "type": "gauge",
  "theme": "none",
  "axes": [ {
    "axisThickness": 1,
    "axisAlpha": 0.2,
    "tickAlpha": 0.2,
    "valueInterval": 20,
    "bands": [ {
      "color": "#84b761",
      "endValue": 90,
      "startValue": 0
    }, {
      "color": "#fdd400",
      "endValue": 130,
      "startValue": 90
    }, {
      "color": "#cc4748",
      "endValue": 220,
      "innerRadius": "95%",
      "startValue": 130
    } ],
    "bottomText": "0 km/h",
    "bottomTextYOffset": -20,
    "endValue": 220
  } ],
  "arrows": [ {} ],
  "export": {
    "enabled": true
  }
} );

setInterval( randomValue, 2000 );

// set random value
function randomValue() {
  var value = Math.round( Math.random() * 200 );
  if ( gaugeChart ) {
    if ( gaugeChart.arrows ) {
      if ( gaugeChart.arrows[ 0 ] ) {
        if ( gaugeChart.arrows[ 0 ].setValue ) {
          gaugeChart.arrows[ 0 ].setValue( value );
          gaugeChart.axes[ 0 ].setBottomText( value + " km/h" );
        }
      }
    }
  }
}
</script>

<!-- HTML -->
<div id="chartdiv"></div>