Animated gauge
This demo shows how to implement dynamic, good-looking dashboards.
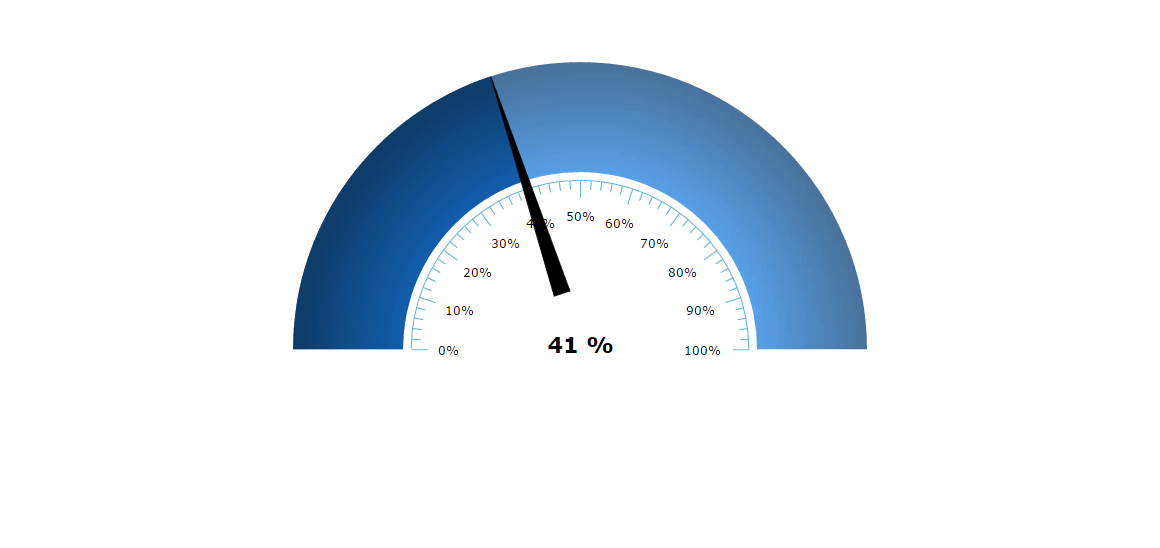
The gradient fill of the GaugeBand is achieved via gradientRatio setting.
The arrow and band angle is updated via setValue() and setStartValue() / setEndValue() API functions respectively.
Demo source
<!-- Styles -->
<style>
#chartdiv {
  width: 100%;
  height: 500px;
}
</style>

<!-- Resources -->
<script src="https://www.amcharts.com/lib/3/amcharts.js"></script>
<script src="https://www.amcharts.com/lib/3/gauge.js"></script>
<script src="https://www.amcharts.com/lib/3/plugins/export/export.min.js"></script>
<link rel="stylesheet" href="https://www.amcharts.com/lib/3/plugins/export/export.css" type="text/css" media="all" />

<!-- Chart code -->
<script>
var chart = AmCharts.makeChart("chartdiv", {
  "theme": "none",
  "type": "gauge",
  "axes": [{
    "topTextFontSize": 20,
    "topTextYOffset": 70,
    "axisColor": "#31d6ea",
    "axisThickness": 1,
    "endValue": 100,
    "gridInside": true,
    "inside": true,
    "radius": "50%",
    "valueInterval": 10,
    "tickColor": "#67b7dc",
    "startAngle": -90,
    "endAngle": 90,
    "unit": "%",
    "bandOutlineAlpha": 0,
    "bands": [{
      "color": "#0080ff",
      "endValue": 100,
      "innerRadius": "105%",
      "radius": "170%",
      "gradientRatio": [0.5, 0, -0.5],
      "startValue": 0
    }, {
      "color": "#3cd3a3",
      "endValue": 0,
      "innerRadius": "105%",
      "radius": "170%",
      "gradientRatio": [0.5, 0, -0.5],
      "startValue": 0
    }]
  }],
  "arrows": [{
    "alpha": 1,
    "innerRadius": "35%",
    "nailRadius": 0,
    "radius": "170%"
  }]
});

setInterval(randomValue, 2000);

// set random value
function randomValue() {
  var value = Math.round(Math.random() * 100);
  chart.arrows[0].setValue(value);
  chart.axes[0].setTopText(value + " %");
  // adjust darker band to new value
  chart.axes[0].bands[1].setEndValue(value);
}
</script>

<!-- HTML -->
<div id="chartdiv"></div>