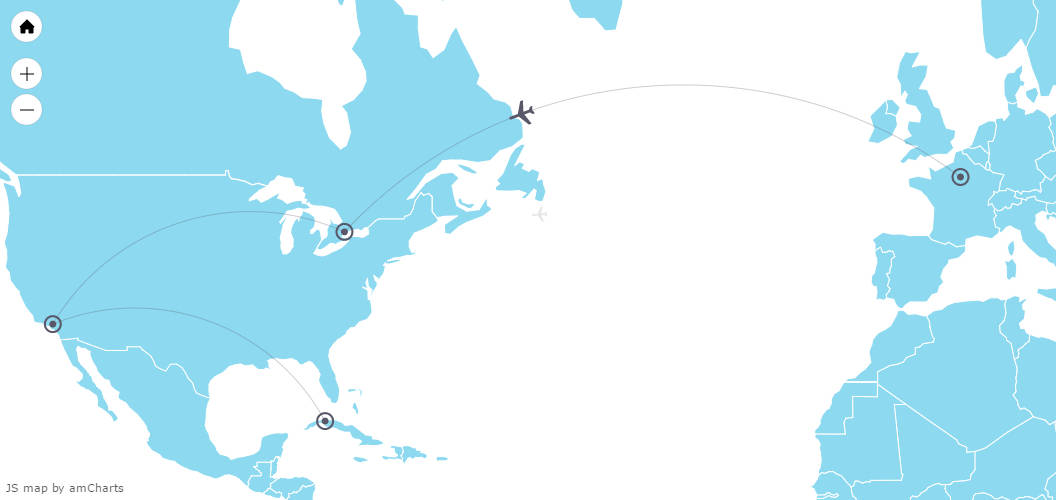
Animations along lines
Images can animate along lines – even if they are curved. All this demo is made using config only – no scripting required!
Demo source
<!-- Styles -->
<style>
#chartdiv {
  width: 100%;
  height: 500px;
}
</style>

<!-- Resources -->
<script src="https://www.amcharts.com/lib/3/ammap.js"></script>
<script src="https://www.amcharts.com/lib/3/maps/js/worldLow.js"></script>
<script src="https://www.amcharts.com/lib/3/plugins/export/export.min.js"></script>
<link rel="stylesheet" href="https://www.amcharts.com/lib/3/plugins/export/export.css" type="text/css" media="all" />

<!-- Chart code -->
<script>
/**
 * SVG path for target icon
 */
var targetSVG = "M9,0C4.029,0,0,4.029,0,9s4.029,9,9,9s9-4.029,9-9S13.971,0,9,0z M9,15.93 c-3.83,0-6.93-3.1-6.93-6.93S5.17,2.07,9,2.07s6.93,3.1,6.93,6.93S12.83,15.93,9,15.93 M12.5,9c0,1.933-1.567,3.5-3.5,3.5S5.5,10.933,5.5,9S7.067,5.5,9,5.5 S12.5,7.067,12.5,9z";

/**
 * SVG path for plane icon
 */
var planeSVG = "m2,106h28l24,30h72l-44,-133h35l80,132h98c21,0 21,34 0,34l-98,0 -80,134h-35l43,-133h-71l-24,30h-28l15,-47";

/**
 * Create the map
 */
var map = AmCharts.makeChart( "chartdiv", {
  "type": "map",
"theme": "none",


  "dataProvider": {
    "map": "worldLow",
    "zoomLevel": 3.5,
    "zoomLongitude": -55,
    "zoomLatitude": 42,

    "lines": [ {
      "id": "line1",
      "arc": -0.85,
      "alpha": 0.3,
      "latitudes": [ 48.8567, 43.8163, 34.3, 23 ],
      "longitudes": [ 2.3510, -79.4287, -118.15, -82 ]
    }, {
      "id": "line2",
      "alpha": 0,
      "color": "#000000",
      "latitudes": [ 48.8567, 43.8163, 34.3, 23 ],
      "longitudes": [ 2.3510, -79.4287, -118.15, -82 ]
    } ],
    "images": [ {
      "svgPath": targetSVG,
      "title": "Paris",
      "latitude": 48.8567,
      "longitude": 2.3510
    }, {
      "svgPath": targetSVG,
      "title": "Toronto",
      "latitude": 43.8163,
      "longitude": -79.4287
    }, {
      "svgPath": targetSVG,
      "title": "Los Angeles",
      "latitude": 34.3,
      "longitude": -118.15
    }, {
      "svgPath": targetSVG,
      "title": "Havana",
      "latitude": 23,
      "longitude": -82
    }, {
      "svgPath": planeSVG,
      "positionOnLine": 0,
      "color": "#000000",
      "alpha": 0.1,
      "animateAlongLine": true,
      "lineId": "line2",
      "flipDirection": true,
      "loop": true,
      "scale": 0.03,
      "positionScale": 1.3
    }, {
      "svgPath": planeSVG,
      "positionOnLine": 0,
      "color": "#585869",
      "animateAlongLine": true,
      "lineId": "line1",
      "flipDirection": true,
      "loop": true,
      "scale": 0.03,
      "positionScale": 1.8
    } ]
  },

  "areasSettings": {
    "unlistedAreasColor": "#8dd9ef"
  },

  "imagesSettings": {
    "color": "#585869",
    "rollOverColor": "#585869",
    "selectedColor": "#585869",
    "pauseDuration": 0.2,
    "animationDuration": 2.5,
    "adjustAnimationSpeed": true
  },

  "linesSettings": {
    "color": "#585869",
    "alpha": 0.4
  },

  "export": {
    "enabled": true
  }

} );
</script>

<!-- HTML -->
<div id="chartdiv"></div>