Changing map projection
Since v 3.19.0 you can change map projections easily. Most of our maps included in the package are made using Mercator projection. Although it’s one of the most popular projections, it’s quite often it is not good because it distorts area of the countries close to poles a lot. We made it possible to set map projection to one of these: Winkel 3 (used by National Geographic), Eckert 3, Eckert 5, Eckert 6, Miller and Equirectangular. We believe these will cover most of the needs. Click on the links below the map to see these projections. You might set initial projection using projection property of AmMap or change it later using map.setProjection(projection) method.
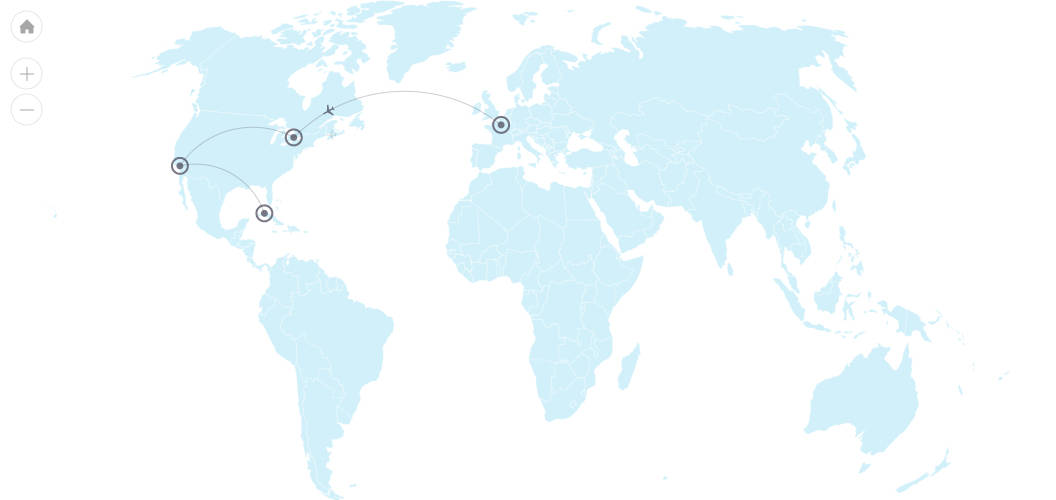
Demo source
<!-- Styles -->
<style>
#chartdiv {
  width: 100%;
  height: 500px;
}
</style>

<!-- Resources -->
<script src="https://www.amcharts.com/lib/3/ammap.js"></script>
<script src="https://www.amcharts.com/lib/3/maps/js/worldLow.js"></script>
<script src="https://www.amcharts.com/lib/3/plugins/export/export.min.js"></script>
<link rel="stylesheet" href="https://www.amcharts.com/lib/3/plugins/export/export.css" type="text/css" media="all" />

<!-- Chart code -->
<script>
/**
 * SVG path for target icon
 */
var targetSVG = "M9,0C4.029,0,0,4.029,0,9s4.029,9,9,9s9-4.029,9-9S13.971,0,9,0z M9,15.93 c-3.83,0-6.93-3.1-6.93-6.93S5.17,2.07,9,2.07s6.93,3.1,6.93,6.93S12.83,15.93,9,15.93 M12.5,9c0,1.933-1.567,3.5-3.5,3.5S5.5,10.933,5.5,9S7.067,5.5,9,5.5 S12.5,7.067,12.5,9z";

/**
 * SVG path for plane icon
 */
var planeSVG = "m2,106h28l24,30h72l-44,-133h35l80,132h98c21,0 21,34 0,34l-98,0 -80,134h-35l43,-133h-71l-24,30h-28l15,-47";

/**
 * Create the map
 */
var map = AmCharts.makeChart( "chartdiv", {
  "type": "map",
"theme": "none",

  "projection": "winkel3",
  "dataProvider": {
    "map": "worldLow",

    "lines": [ {
      "id": "line1",
      "arc": -0.85,
      "alpha": 0.3,
      "latitudes": [ 48.8567, 43.8163, 34.3, 23 ],
      "longitudes": [ 2.3510, -79.4287, -118.15, -82 ]
    }, {
      "id": "line2",
      "alpha": 0,
      "color": "#000000",
      "latitudes": [ 48.8567, 43.8163, 34.3, 23 ],
      "longitudes": [ 2.3510, -79.4287, -118.15, -82 ]
    } ],
    "images": [ {
      "svgPath": targetSVG,
      "title": "Paris",
      "latitude": 48.8567,
      "longitude": 2.3510
    }, {
      "svgPath": targetSVG,
      "title": "Toronto",
      "latitude": 43.8163,
      "longitude": -79.4287
    }, {
      "svgPath": targetSVG,
      "title": "Los Angeles",
      "latitude": 34.3,
      "longitude": -118.15
    }, {
      "svgPath": targetSVG,
      "title": "Havana",
      "latitude": 23,
      "longitude": -82
    }, {
      "svgPath": planeSVG,
      "positionOnLine": 0,
      "color": "#000000",
      "alpha": 0.1,
      "animateAlongLine": true,
      "lineId": "line2",
      "flipDirection": true,
      "loop": true,
      "scale": 0.03,
      "positionScale": 1.3
    }, {
      "svgPath": planeSVG,
      "positionOnLine": 0,
      "color": "#585869",
      "animateAlongLine": true,
      "lineId": "line1",
      "flipDirection": true,
      "loop": true,
      "scale": 0.03,
      "positionScale": 1.8
    } ]
  },

  "areasSettings": {
    "unlistedAreasColor": "#8dd9ef"
  },

  "imagesSettings": {
    "color": "#585869",
    "rollOverColor": "#585869",
    "selectedColor": "#585869",
    "pauseDuration": 0.2,
    "animationDuration": 4,
    "adjustAnimationSpeed": true
  },

  "linesSettings": {
    "color": "#585869",
    "alpha": 0.4
  },

  "export": {
    "enabled": true
  }

} );
</script>

<!-- HTML -->
<div id="chartdiv"></div>