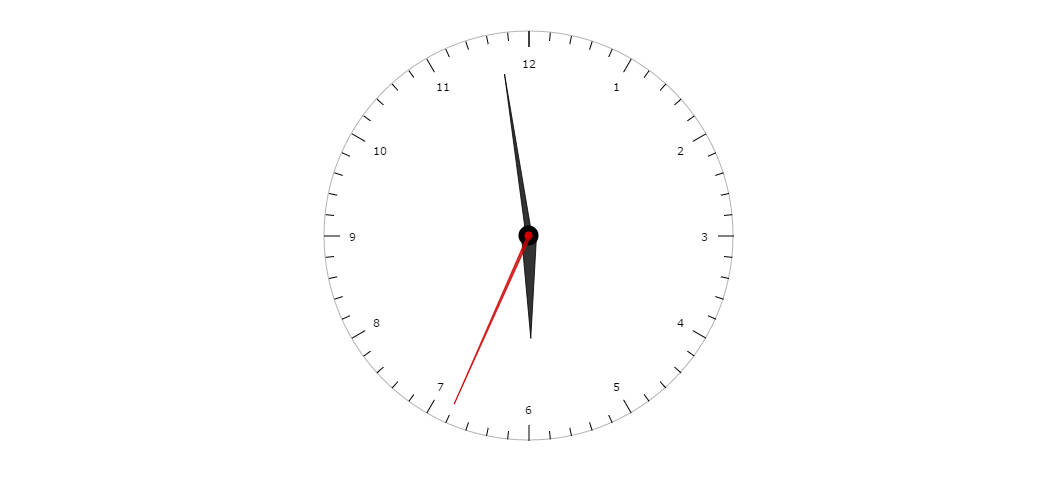
Clock
This clock is made using our AmAngularGauge chart. You can have multiple faces (axes), and multiple arrows on one chart. The chart can be saved as an image using the download image in the bottom-right corner. Check CHALK theme (buttons above the chart) to see fun animation of the arrows.
Demo source
<!-- Styles -->
<style>
#chartdiv {
	width	: 100%;
	height	: 500px;
}
</style>

<!-- Resources -->
<script src="https://www.amcharts.com/lib/3/amcharts.js"></script>
<script src="https://www.amcharts.com/lib/3/gauge.js"></script>
<script src="https://www.amcharts.com/lib/3/plugins/export/export.min.js"></script>
<link rel="stylesheet" href="https://www.amcharts.com/lib/3/plugins/export/export.css" type="text/css" media="all" />

<!-- Chart code -->
<script>
var chart = AmCharts.makeChart( "chartdiv", {
  "type": "gauge",
  "theme": "none",
  "startDuration": 0.3,
  "marginTop": 20,
  "marginBottom": 50,
  "axes": [ {
    "axisAlpha": 0.3,
    "endAngle": 360,
    "endValue": 12,
    "minorTickInterval": 0.2,
    "showFirstLabel": false,
    "startAngle": 0,
    "axisThickness": 1,
    "valueInterval": 1
  } ],
  "arrows": [ {
    "radius": "50%",
    "innerRadius": 0,
    "clockWiseOnly": true,
    "nailRadius": 10,
    "nailAlpha": 1
  }, {
    "nailRadius": 0,
    "radius": "80%",
    "startWidth": 6,
    "innerRadius": 0,
    "clockWiseOnly": true
  }, {
    "color": "#CC0000",
    "nailRadius": 4,
    "startWidth": 3,
    "innerRadius": 0,
    "clockWiseOnly": true,
    "nailAlpha": 1
  } ],
  "export": {
    "enabled": true
  }
} );

// update each second
setInterval( updateClock, 1000 );

// update clock
function updateClock() {
  if(chart.arrows.length > 0){
    // get current date
    var date = new Date();
    var hours = date.getHours();
    var minutes = date.getMinutes();
    var seconds = date.getSeconds();

    if(chart.arrows[ 0 ].setValue){
      // set hours
      chart.arrows[ 0 ].setValue( hours + minutes / 60 );
      // set minutes
      chart.arrows[ 1 ].setValue( 12 * ( minutes + seconds / 60 ) / 60 );
      // set seconds
      chart.arrows[ 2 ].setValue( 12 * date.getSeconds() / 60 );
      }
  }
}
</script>

<!-- HTML -->
<div id="chartdiv"></div>