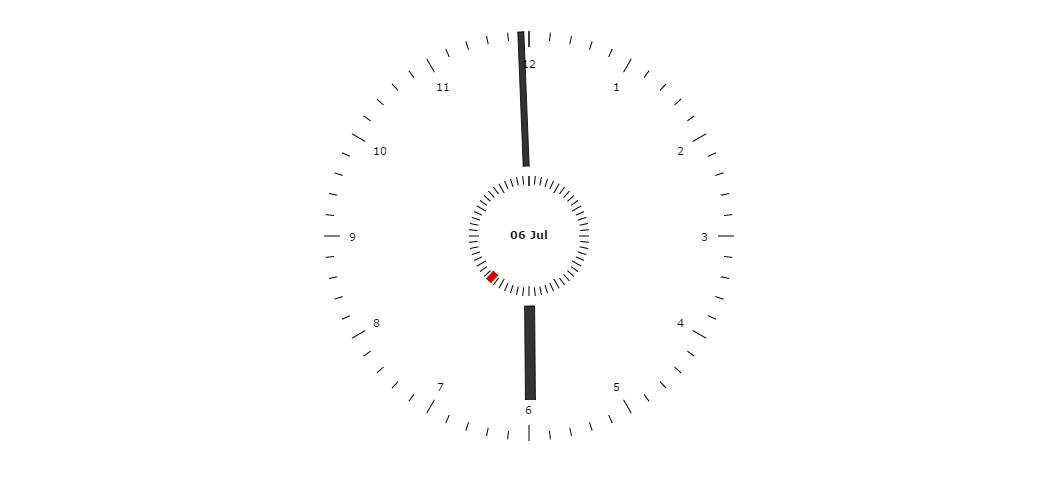
Clock With Two Faces
This clock is made using our AmAngularGauge chart and it has two faces – one for hours/minutes and another for seconds. As you see the shape of the arrows can be easily adjusted to almost any you might need. You can have multiple faces (axes), and multiple arrows on one chart. The chart can be saved as an image using the download image in the bottom-right corner. Check CHALK theme (buttons above the chart) to see fun animation of the arrows.
Demo source
<!-- Styles -->
<style>
#chartdiv {
	width	: 100%;
	height	: 500px;
}
</style>

<!-- Resources -->
<script src="https://www.amcharts.com/lib/3/amcharts.js"></script>
<script src="https://www.amcharts.com/lib/3/gauge.js"></script>
<script src="https://www.amcharts.com/lib/3/plugins/export/export.min.js"></script>
<link rel="stylesheet" href="https://www.amcharts.com/lib/3/plugins/export/export.css" type="text/css" media="all" />

<!-- Chart code -->
<script>
var chart = AmCharts.makeChart( "chartdiv", {
  "type": "gauge",
  "theme": "none",
  "startDuration": 0.1,
  "marginTop": 20,
  "marginBottom": 50,
  "axes": [ {
    "id": "axis1",
    "axisAlpha": 0,
    "endAngle": 360,
    "endValue": 12,
    "minorTickInterval": 0.2,
    "showFirstLabel": false,
    "startAngle": 0,
    "topTextYOffset": 100,
    "valueInterval": 1
  }, {
    "id": "axis2",
    "axisAlpha": 0,
    "endAngle": 360,
    "endValue": 60,
    "radius": 60,
    "showFirstLabel": false,
    "startAngle": 0,
    "valueInterval": 5,
    "labelFrequency": 0,
    "tickLength": 10
  } ],
  "arrows": [ {
    "innerRadius": 70,
    "nailRadius": 0,
    "radius": "80%",
    "startWidth": 10,
    "endWidth": 10
  }, {
    "innerRadius": 70,
    "nailRadius": 0,
    "radius": "100%",
    "startWidth": 6,
    "endWidth": 6
  }, {
    "axis": "axis2",
    "color": "#CC0000",
    "innerRadius": 50,
    "nailRadius": 0,
    "radius": "100%",
    "startWidth": 6,
    "endWidth": 6,
    "alpha": 1
  } ],
  "export": {
    "enabled": true
  }
} );

interval = setInterval( updateClock, 1000 );


// update clock
function updateClock() {
  // get date
  var date = new Date();
  var hours = date.getHours();
  var minutes = date.getMinutes();
  var seconds = date.getSeconds();

  if(chart.arrows[ 0 ].setValue){
    // update hours
    chart.arrows[ 0 ].setValue( hours + minutes / 60 );
    // update minutes
    chart.arrows[ 1 ].setValue( 12 * ( minutes + seconds / 60 ) / 60 );
    // update seconds
    chart.arrows[ 2 ].setValue( date.getSeconds() );

    // update date
    var dateString = AmCharts.formatDate( date, "DD MMM" );
    chart.axes[ 0 ].setTopText( dateString );
  }
}
</script>

<!-- HTML -->
<div id="chartdiv"></div>