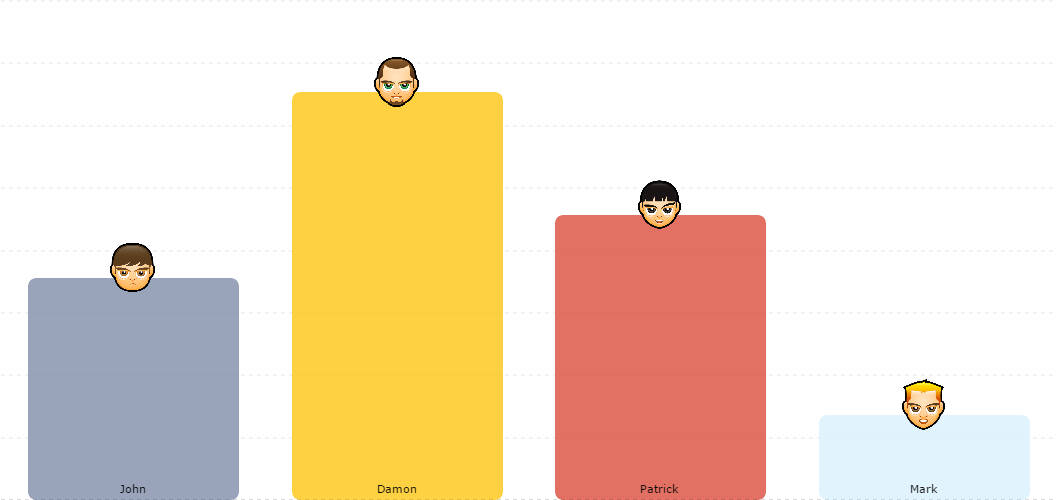
Column chart with images on top
Our charts do support custom bullets, this means you can have them on column chart too. It’s quite often scenario that a company logo or some other image is to be placed above the column – check this example, it’s quite easy to do.
Demo source
<!-- Styles -->
<style>
#chartdiv {
	width	: 100%;
	height	: 500px;
}
</style>

<!-- Resources -->
<script src="https://www.amcharts.com/lib/3/amcharts.js"></script>
<script src="https://www.amcharts.com/lib/3/serial.js"></script>
<script src="https://www.amcharts.com/lib/3/plugins/export/export.min.js"></script>
<link rel="stylesheet" href="https://www.amcharts.com/lib/3/plugins/export/export.css" type="text/css" media="all" />

<!-- Chart code -->
<script>
var chart = AmCharts.makeChart("chartdiv",
{
    "type": "serial",
    "theme": "none",
    "dataProvider": [{
        "name": "John",
        "points": 35654,
        "color": "#7F8DA9",
        "bullet": "https://www.amcharts.com/lib/images/faces/A04.png"
    }, {
        "name": "Damon",
        "points": 65456,
        "color": "#FEC514",
        "bullet": "https://www.amcharts.com/lib/images/faces/C02.png"
    }, {
        "name": "Patrick",
        "points": 45724,
        "color": "#DB4C3C",
        "bullet": "https://www.amcharts.com/lib/images/faces/D02.png"
    }, {
        "name": "Mark",
        "points": 13654,
        "color": "#DAF0FD",
        "bullet": "https://www.amcharts.com/lib/images/faces/E01.png"
    }],
    "valueAxes": [{
        "maximum": 80000,
        "minimum": 0,
        "axisAlpha": 0,
        "dashLength": 4,
        "position": "left"
    }],
    "startDuration": 1,
    "graphs": [{
        "balloonText": "<span style='font-size:13px;'>[[category]]: <b>[[value]]</b></span>",
        "bulletOffset": 10,
        "bulletSize": 52,
        "colorField": "color",
        "cornerRadiusTop": 8,
        "customBulletField": "bullet",
        "fillAlphas": 0.8,
        "lineAlpha": 0,
        "type": "column",
        "valueField": "points"
    }],
    "marginTop": 0,
    "marginRight": 0,
    "marginLeft": 0,
    "marginBottom": 0,
    "autoMargins": false,
    "categoryField": "name",
    "categoryAxis": {
        "axisAlpha": 0,
        "gridAlpha": 0,
        "inside": true,
        "tickLength": 0
    },
    "export": {
    	"enabled": true
     }
});
</script>

<!-- HTML -->
<div id="chartdiv"></div>