CSS animations
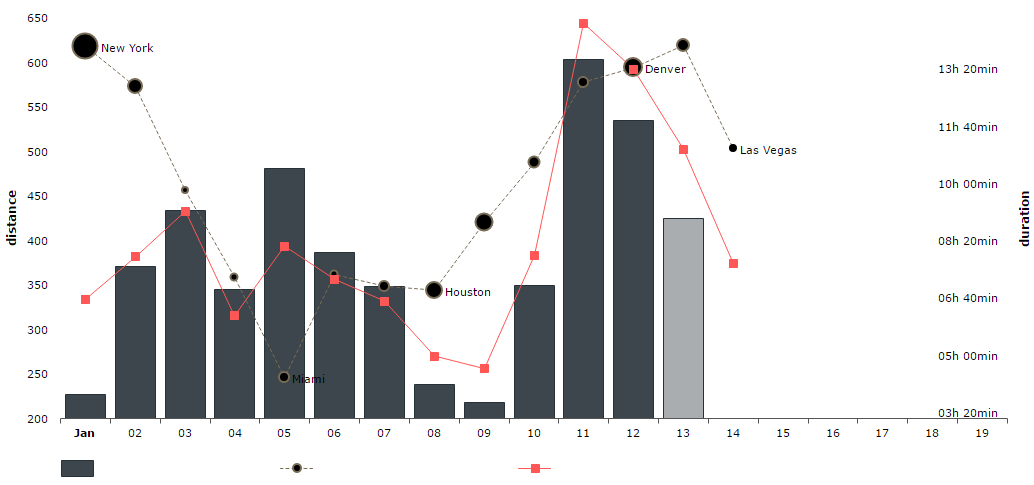
Since v 3.12.0 all elements of the chart can have class names set – all you need to do is setting addClassNames property of a chart to true. This feature allows you to control the look of a chart using CSS and even more – use CSS animation to highlight specific areas in your chart. Note, CSS animations are not available on all browsers – even modern IE doesn’t support them. Be careful – CSS animations use a lot of CPU resources.
Demo source
<!-- Styles -->
<style>
#chartdiv{
  width: 100%;
  height: 500px;
}

.amcharts-graph-g2 .amcharts-graph-stroke {
  stroke-dasharray: 3px 3px;
  stroke-linejoin: round;
  stroke-linecap: round;
  -webkit-animation: am-moving-dashes 1s linear infinite;
  animation: am-moving-dashes 1s linear infinite;
}

@-webkit-keyframes am-moving-dashes {
  100% {
    stroke-dashoffset: -31px;
  }
}
@keyframes am-moving-dashes {
  100% {
    stroke-dashoffset: -31px;
  }
}


.lastBullet {
  -webkit-animation: am-pulsating 1s ease-out infinite;
  animation: am-pulsating 1s ease-out infinite;
}
@-webkit-keyframes am-pulsating {
  0% {
    stroke-opacity: 1;
    stroke-width: 0px;
  }
  100% {
    stroke-opacity: 0;
    stroke-width: 50px;
  }
}
@keyframes am-pulsating {
  0% {
    stroke-opacity: 1;
    stroke-width: 0px;
  }
  100% {
    stroke-opacity: 0;
    stroke-width: 50px;
  }
}

.amcharts-graph-column-front {
  -webkit-transition: all .3s .3s ease-out;
  transition: all .3s .3s ease-out;
}
.amcharts-graph-column-front:hover {
  fill: #496375;
  stroke: #496375;
  -webkit-transition: all .3s ease-out;
  transition: all .3s ease-out;
}

.amcharts-graph-g3 {
  stroke-linejoin: round;
  stroke-linecap: round;
  stroke-dasharray: 500%;
  stroke-dasharray: 0 /;    /* fixes IE prob */
  stroke-dashoffset: 0 /;   /* fixes IE prob */
  -webkit-animation: am-draw 40s;
  animation: am-draw 40s;
}
@-webkit-keyframes am-draw {
    0% {
        stroke-dashoffset: 500%;
    }
    100% {
        stroke-dashoffset: 0%;
    }
}
@keyframes am-draw {
    0% {
        stroke-dashoffset: 500%;
    }
    100% {
        stroke-dashoffset: 0%;
    }
}
/* OVERWRITE OUR MAIN STYLE */
.demo-flipper-front.demo-panel-white, body {
  background-color: #161616;
}
</style>

<!-- Resources -->
<script src="https://www.amcharts.com/lib/3/amcharts.js"></script>
<script src="https://www.amcharts.com/lib/3/serial.js"></script>
<script src="https://www.amcharts.com/lib/3/plugins/export/export.min.js"></script>
<link rel="stylesheet" href="https://www.amcharts.com/lib/3/plugins/export/export.css" type="text/css" media="all" />

<!-- Chart code -->
<script>
var chartData = [ {
  "date": "2012-01-01",
  "distance": 227,
  "townName": "New York",
  "townName2": "New York",
  "townSize": 25,
  "latitude": 40.71,
  "duration": 408
}, {
  "date": "2012-01-02",
  "distance": 371,
  "townName": "Washington",
  "townSize": 14,
  "latitude": 38.89,
  "duration": 482
}, {
  "date": "2012-01-03",
  "distance": 433,
  "townName": "Wilmington",
  "townSize": 6,
  "latitude": 34.22,
  "duration": 562
}, {
  "date": "2012-01-04",
  "distance": 345,
  "townName": "Jacksonville",
  "townSize": 7,
  "latitude": 30.35,
  "duration": 379
}, {
  "date": "2012-01-05",
  "distance": 480,
  "townName": "Miami",
  "townName2": "Miami",
  "townSize": 10,
  "latitude": 25.83,
  "duration": 501
}, {
  "date": "2012-01-06",
  "distance": 386,
  "townName": "Tallahassee",
  "townSize": 7,
  "latitude": 30.46,
  "duration": 443
}, {
  "date": "2012-01-07",
  "distance": 348,
  "townName": "New Orleans",
  "townSize": 10,
  "latitude": 29.94,
  "duration": 405
}, {
  "date": "2012-01-08",
  "distance": 238,
  "townName": "Houston",
  "townName2": "Houston",
  "townSize": 16,
  "latitude": 29.76,
  "duration": 309
}, {
  "date": "2012-01-09",
  "distance": 218,
  "townName": "Dalas",
  "townSize": 17,
  "latitude": 32.8,
  "duration": 287
}, {
  "date": "2012-01-10",
  "distance": 349,
  "townName": "Oklahoma City",
  "townSize": 11,
  "latitude": 35.49,
  "duration": 485
}, {
  "date": "2012-01-11",
  "distance": 603,
  "townName": "Kansas City",
  "townSize": 10,
  "latitude": 39.1,
  "duration": 890
}, {
  "date": "2012-01-12",
  "distance": 534,
  "townName": "Denver",
  "townName2": "Denver",
  "townSize": 18,
  "latitude": 39.74,
  "duration": 810
}, {
  "date": "2012-01-13",
  "townName": "Salt Lake City",
  "townSize": 12,
  "distance": 425,
  "duration": 670,
  "latitude": 40.75,
  "alpha": 0.4
}, {
  "date": "2012-01-14",
  "latitude": 36.1,
  "duration": 470,
  "townName": "Las Vegas",
  "townName2": "Las Vegas",
  "bulletClass": "lastBullet"
}, {
  "date": "2012-01-15"
}, {
  "date": "2012-01-16"
}, {
  "date": "2012-01-17"
}, {
  "date": "2012-01-18"
}, {
  "date": "2012-01-19"
} ];
var chart = AmCharts.makeChart( "chartdiv", {
  "type": "serial",
"theme": "none",

  "dataDateFormat": "YYYY-MM-DD",
  "dataProvider": chartData,

  "addClassNames": true,
  "startDuration": 1,
  //"color": "#FFFFFF",
  "marginLeft": 0,

  "categoryField": "date",
  "categoryAxis": {
    "parseDates": true,
    "minPeriod": "DD",
    "autoGridCount": false,
    "gridCount": 50,
    "gridAlpha": 0.1,
    "gridColor": "#FFFFFF",
    "axisColor": "#555555",
    "dateFormats": [ {
      "period": 'DD',
      "format": 'DD'
    }, {
      "period": 'WW',
      "format": 'MMM DD'
    }, {
      "period": 'MM',
      "format": 'MMM'
    }, {
      "period": 'YYYY',
      "format": 'YYYY'
    } ]
  },

  "valueAxes": [ {
    "id": "a1",
    "title": "distance",
    "gridAlpha": 0,
    "axisAlpha": 0
  }, {
    "id": "a2",
    "position": "right",
    "gridAlpha": 0,
    "axisAlpha": 0,
    "labelsEnabled": false
  }, {
    "id": "a3",
    "title": "duration",
    "position": "right",
    "gridAlpha": 0,
    "axisAlpha": 0,
    "inside": true,
    "duration": "mm",
    "durationUnits": {
      "DD": "d. ",
      "hh": "h ",
      "mm": "min",
      "ss": ""
    }
  } ],
  "graphs": [ {
    "id": "g1",
    "valueField": "distance",
    "title": "distance",
    "type": "column",
    "fillAlphas": 0.9,
    "valueAxis": "a1",
    "balloonText": "[[value]] miles",
    "legendValueText": "[[value]] mi",
    "legendPeriodValueText": "total: [[value.sum]] mi",
    "lineColor": "#263138",
    "alphaField": "alpha"
  }, {
    "id": "g2",
    "valueField": "latitude",
    "classNameField": "bulletClass",
    "title": "latitude/city",
    "type": "line",
    "valueAxis": "a2",
    "lineColor": "#786c56",
    "lineThickness": 1,
    "legendValueText": "[[value]]/[[description]]",
    "descriptionField": "townName",
    "bullet": "round",
    "bulletSizeField": "townSize",
    "bulletBorderColor": "#786c56",
    "bulletBorderAlpha": 1,
    "bulletBorderThickness": 2,
    "bulletColor": "#000000",
    "labelText": "[[townName2]]",
    "labelPosition": "right",
    "balloonText": "latitude:[[value]]",
    "showBalloon": true,
    "animationPlayed": true
  }, {
    "id": "g3",
    "title": "duration",
    "valueField": "duration",
    "type": "line",
    "valueAxis": "a3",
    "lineColor": "#ff5755",
    "balloonText": "[[value]]",
    "lineThickness": 1,
    "legendValueText": "[[value]]",
    "bullet": "square",
    "bulletBorderColor": "#ff5755",
    "bulletBorderThickness": 1,
    "bulletBorderAlpha": 1,
    "dashLengthField": "dashLength",
    "animationPlayed": true
  } ],

  "chartCursor": {
    "zoomable": false,
    "categoryBalloonDateFormat": "DD",
    "cursorAlpha": 0,
    "valueBalloonsEnabled": false
  },
  "legend": {
    "bulletType": "round",
    "equalWidths": false,
    "valueWidth": 120,
    "useGraphSettings": true,
    //"color": "#FFFFFF"
  }
} );
</script>

<!-- HTML -->
<div id="chartdiv"></div>