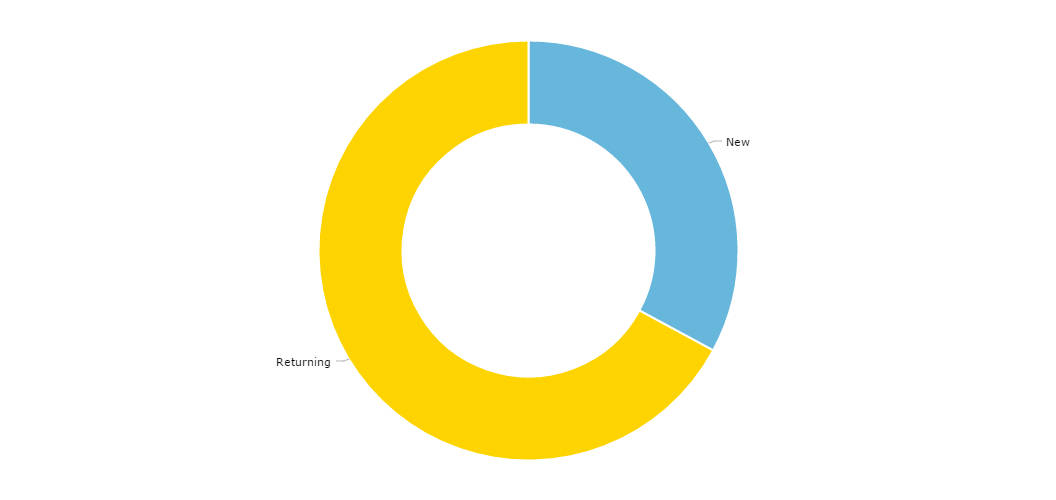
Donut chart
Donut or Doughnut chart is just a simple pie chart with a hole inside. You can define hole radius to any size you need, both in percent or pixels.
Donut chart with patterns
Click on PATTERNS theme above the chart – you will see that our pie or donut chart supports patterns. There are several pre-build patterns in our package or you can easily build your own fancy patterns and use them with our charts.
Demo source
<!-- Styles -->
<style>
#chartdiv {
	width		: 100%;
	height		: 500px;
	font-size	: 11px;
}
</style>

<!-- Resources -->
<script src="https://www.amcharts.com/lib/3/amcharts.js"></script>
<script src="https://www.amcharts.com/lib/3/pie.js"></script>
<script src="https://www.amcharts.com/lib/3/plugins/export/export.min.js"></script>
<link rel="stylesheet" href="https://www.amcharts.com/lib/3/plugins/export/export.css" type="text/css" media="all" />

<!-- Chart code -->
<script>
var chart = AmCharts.makeChart( "chartdiv", {
  "type": "pie",
  "theme": "none",
  "dataProvider": [ {
    "title": "New",
    "value": 4852
  }, {
    "title": "Returning",
    "value": 9899
  } ],
  "titleField": "title",
  "valueField": "value",
  "labelRadius": 5,

  "radius": "42%",
  "innerRadius": "60%",
  "labelText": "[[title]]",
  "export": {
    "enabled": true
  }
} );
</script>

<!-- HTML -->
<div id="chartdiv"></div>