Error Chart
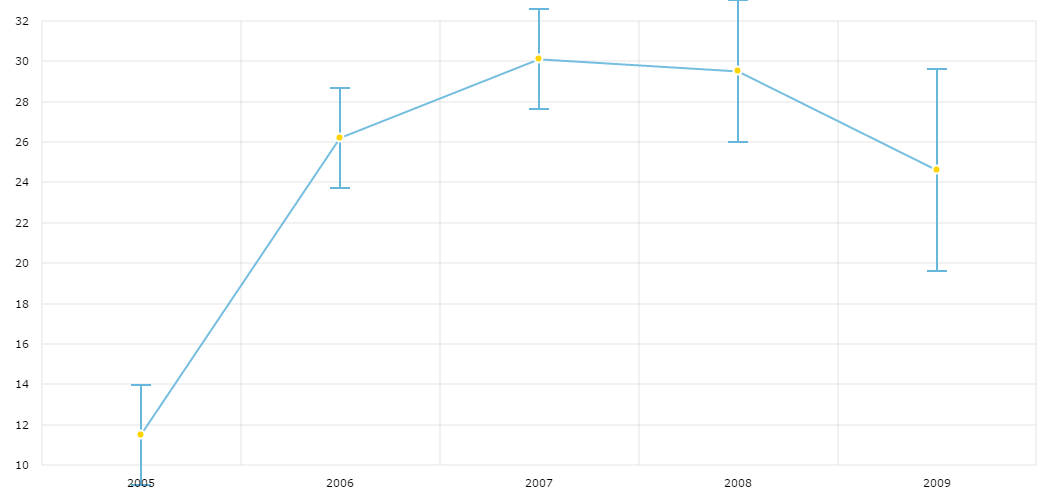
Error bars are show the variability of data and are used on graphs to indicate the error, or uncertainty in a reported measurement. They give an idea of how far from the reported value the true value might be.
Error chart using amCharts
In our case, error chart is a regular serial chart with special type of bullets – yError. As you might guess, there is also xError bullet type, but it can only be used by Scatter/Bubble chart for showing the error on x axis. To make the chart show error bar, you need to set “bullet”: “yError”, also “bulletAxis”: “v1” where “v1” is id of the axis which is used to determine the size of the bar and finally, “errorField”: “error” – the name of the field in your data provider which holds error value. The size of horizontal dash is defined by “bulletSize”: 10.
Demo source
<!-- Styles -->
<style>
#chartdiv {
	width	: 100%;
	height	: 500px;
}
</style>

<!-- Resources -->
<script src="https://www.amcharts.com/lib/3/amcharts.js"></script>
<script src="https://www.amcharts.com/lib/3/serial.js"></script>
<script src="https://www.amcharts.com/lib/3/plugins/export/export.min.js"></script>
<link rel="stylesheet" href="https://www.amcharts.com/lib/3/plugins/export/export.css" type="text/css" media="all" />

<!-- Chart code -->
<script>
var chart = AmCharts.makeChart( "chartdiv", {
  "type": "serial",
  "theme": "none",
  "dataProvider": [ {
    "year": 2005,
    "value": 11.5,
    "error": 5
  }, {
    "year": 2006,
    "value": 26.2,
    "error": 5
  }, {
    "year": 2007,
    "value": 30.1,
    "error": 5
  }, {
    "year": 2008,
    "value": 29.5,
    "error": 7
  }, {
    "year": 2009,
    "value": 24.6,
    "error": 10
  } ],
  "balloon": {
    "textAlign": "left"
  },
  "valueAxes": [ {
    "id": "v1",
    "axisAlpha": 0
  } ],
  "startDuration": 1,
  "graphs": [ {
    "balloonText": "value:<b>[[value]]</b><br>error:<b>[[error]]</b>",
    "bullet": "yError",
    "bulletSize": 10,
    "errorField": "error",
    "lineThickness": 2,
    "valueField": "value",
    "bulletAxis": "v1",
    "fillAlphas": 0
  }, {
    "bullet": "round",
    "bulletBorderAlpha": 1,
    "bulletBorderColor": "#FFFFFF",
    "lineAlpha": 0,
    "lineThickness": 2,
    "showBalloon": false,
    "valueField": "value"

  } ],
  "chartCursor": {
    "cursorAlpha": 0,
    "cursorPosition": "mouse",
    "graphBulletSize": 1,
    "zoomable": false
  },
  "categoryField": "year",
  "categoryAxis": {
    "gridPosition": "start",
    "axisAlpha": 0
  },
  "export": {
    "enabled": true
  }
} );
</script>

<!-- HTML -->
<div id="chartdiv"></div>