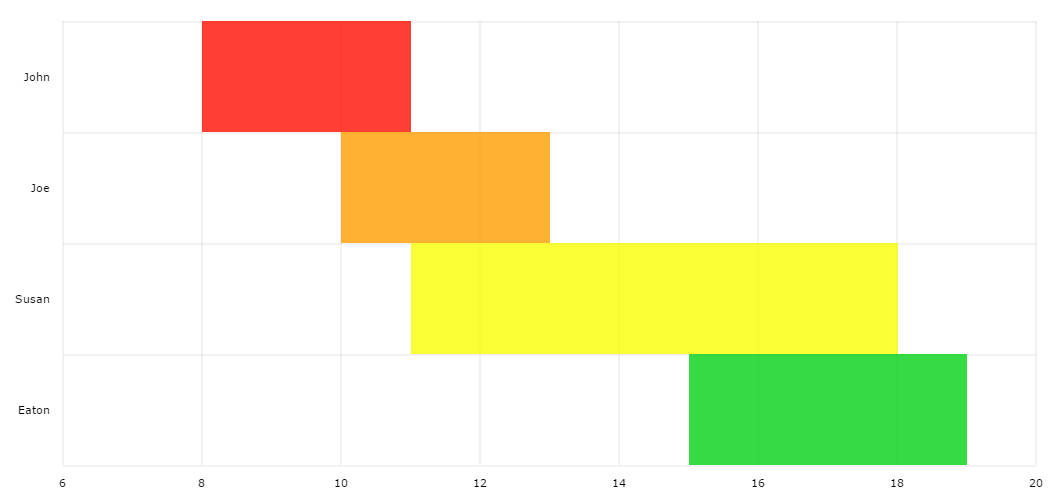
Floating Bar Chart
As you can see, the bars (also columns) in our charts can start and end at any place, not necessary from axis or zero-coordinate. All you need to do is set openField for column graph and set the open values in data. For a floating-columns check Waterfall chart demo.
Demo source
<!-- Styles -->
<style>
#chartdiv {
	width	: 100%;
	height	: 500px;
}
</style>

<!-- Resources -->
<script src="https://www.amcharts.com/lib/3/amcharts.js"></script>
<script src="https://www.amcharts.com/lib/3/serial.js"></script>
<script src="https://www.amcharts.com/lib/3/plugins/export/export.min.js"></script>
<link rel="stylesheet" href="https://www.amcharts.com/lib/3/plugins/export/export.css" type="text/css" media="all" />

<!-- Chart code -->
<script>
var chart = AmCharts.makeChart("chartdiv", {
	"theme": "none",
    "type": "serial",
    "dataProvider": [{
        "name": "John",
        "startTime": 8,
        "endTime": 11,
        "color": "#FF0F00"
    }, {
        "name": "Joe",
        "startTime": 10,
        "endTime": 13,
        "color": "#FF9E01"
    }, {
        "name": "Susan",
        "startTime": 11,
        "endTime": 18,
        "color": "#F8FF01"
    }, {
        "name": "Eaton",
        "startTime": 15,
        "endTime": 19,
        "color": "#04D215"
    }],
    "valueAxes": [{
        "axisAlpha": 0,
        "gridAlpha": 0.1
    }],
    "startDuration": 1,
    "graphs": [{
        "balloonText": "<b>[[category]]</b><br>starts at [[startTime]]<br>ends at [[endTime]]",
        "colorField": "color",
        "fillAlphas": 0.8,
        "lineAlpha": 0,
        "openField": "startTime",
        "type": "column",
        "valueField": "endTime"
    }],
    "rotate": true,
    "columnWidth": 1,
    "categoryField": "name",
    "categoryAxis": {
        "gridPosition": "start",
        "axisAlpha": 0,
        "gridAlpha": 0.1,
        "position": "left"
    },
    "export": {
    	"enabled": true
     }
});
</script>

<!-- HTML -->
<div id="chartdiv"></div>