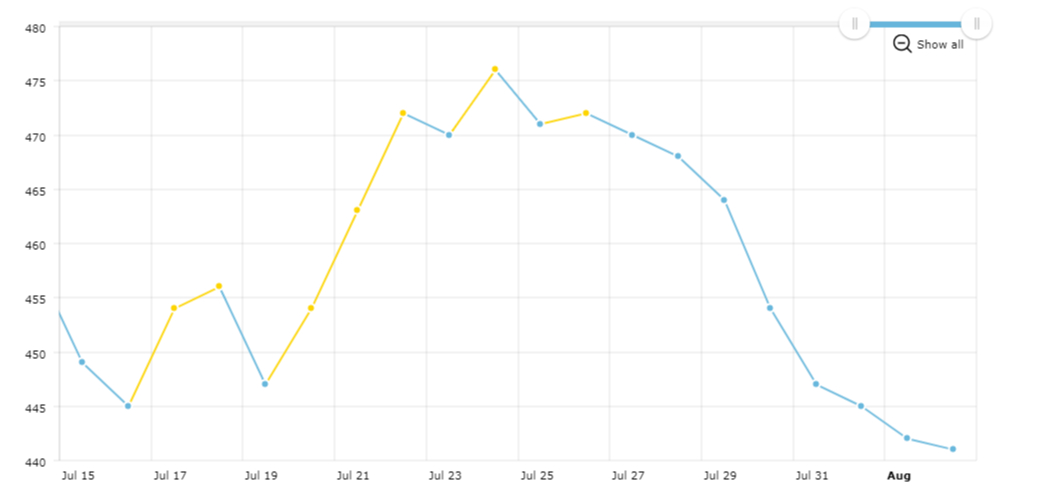
Line with different colors for ups and downs
As you see, the line graph can use different color for ups and downs. If previous value is bigger than current value, the line will use negativeLineColor. This feature can also be used with step and column graphs. To use it, you must set useNegativeColorIfDown to true. In case you define openField for the graph, values will be compared to openField instead of previous values.
Demo source
<!-- Styles -->
<style>
#chartdiv {
	width		: 100%;
	height		: 500px;
	font-size	: 11px;
}
</style>

<!-- Resources -->
<script src="https://www.amcharts.com/lib/3/amcharts.js"></script>
<script src="https://www.amcharts.com/lib/3/serial.js"></script>
<script src="https://www.amcharts.com/lib/3/plugins/export/export.min.js"></script>
<link rel="stylesheet" href="https://www.amcharts.com/lib/3/plugins/export/export.css" type="text/css" media="all" />

<!-- Chart code -->
<script>
var chartData = generatechartData();

function generatechartData() {
    var chartData = [];
    var firstDate = new Date();
    firstDate.setDate(firstDate.getDate() - 150);
    var visits = 500;

    for (var i = 0; i < 150; i++) {
        // we create date objects here. In your data, you can have date strings
        // and then set format of your dates using chart.dataDateFormat property,
        // however when possible, use date objects, as this will speed up chart rendering.
        var newDate = new Date(firstDate);
        newDate.setDate(newDate.getDate() + i);

        visits += Math.round((Math.random()<0.5?1:-1)*Math.random()*10);

        chartData.push({
            date: newDate,
            visits: visits
        });
    }
    return chartData;
}


var chart = AmCharts.makeChart("chartdiv", {
    "theme": "none",
    "type": "serial",
    "marginRight": 80,
    "autoMarginOffset": 20,
    "marginTop":20,
    "dataProvider": chartData,
    "valueAxes": [{
        "id": "v1",
        "axisAlpha": 0.1
    }],
    "graphs": [{
        "useNegativeColorIfDown": true,
        "balloonText": "[[category]]<br><b>value: [[value]]</b>",
        "bullet": "round",
        "bulletBorderAlpha": 1,
        "bulletBorderColor": "#FFFFFF",
        "hideBulletsCount": 50,
        "lineThickness": 2,
        "lineColor": "#fdd400",
        "negativeLineColor": "#67b7dc",
        "valueField": "visits"
    }],
    "chartScrollbar": {
        "scrollbarHeight": 5,
        "backgroundAlpha": 0.1,
        "backgroundColor": "#868686",
        "selectedBackgroundColor": "#67b7dc",
        "selectedBackgroundAlpha": 1
    },
    "chartCursor": {
        "valueLineEnabled": true,
        "valueLineBalloonEnabled": true
    },
    "categoryField": "date",
    "categoryAxis": {
        "parseDates": true,
        "axisAlpha": 0,
        "minHorizontalGap": 60
    },
    "export": {
        "enabled": true
    }
});

chart.addListener("dataUpdated", zoomChart);
//zoomChart();

function zoomChart() {
    if (chart.zoomToIndexes) {
        chart.zoomToIndexes(130, chartData.length - 1);
    }
}
</script>

<!-- HTML -->
<div id="chartdiv"></div>