Logarithmic Scale
For data, which grows exponentially you might need logarithmic scale axis. This is quite often used in financial charts, to show the grow of stocks over a long period. The use of the logarithms of the values rather than the actual values reduces a wide range to a more manageable size.
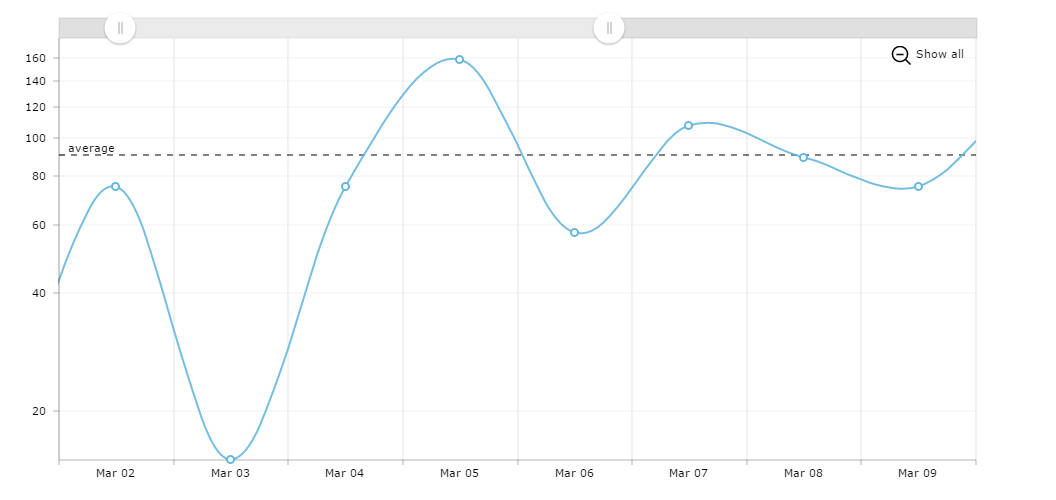
Using guides for horizontal or vertical lines
Both value and category axis can display guides – straight infinite lines, possibly with text annotations next to them. You can use this feature to show average values, mark events, color some value ranges to indicate a possible value fluctuation and more.
Demo source
<!-- Styles -->
<style>
#chartdiv {
	width	: 100%;
	height	: 500px;
}
</style>

<!-- Resources -->
<script src="https://www.amcharts.com/lib/3/amcharts.js"></script>
<script src="https://www.amcharts.com/lib/3/serial.js"></script>
<script src="https://www.amcharts.com/lib/3/plugins/export/export.min.js"></script>
<link rel="stylesheet" href="https://www.amcharts.com/lib/3/plugins/export/export.css" type="text/css" media="all" />

<!-- Chart code -->
<script>
var chart = AmCharts.makeChart("chartdiv", {
    "type": "serial",
    "theme": "none",
    "marginRight": 80,
    "marginTop": 17,
    "autoMarginOffset": 20,
    "dataProvider": [{
        "date": "2012-03-01",
        "price": 20
    }, {
        "date": "2012-03-02",
        "price": 75
    }, {
        "date": "2012-03-03",
        "price": 15
    }, {
        "date": "2012-03-04",
        "price": 75
    }, {
        "date": "2012-03-05",
        "price": 158
    }, {
        "date": "2012-03-06",
        "price": 57
    }, {
        "date": "2012-03-07",
        "price": 107
    }, {
        "date": "2012-03-08",
        "price": 89
    }, {
        "date": "2012-03-09",
        "price": 75
    }, {
        "date": "2012-03-10",
        "price": 132
    }, {
        "date": "2012-03-11",
        "price": 158
    }, {
        "date": "2012-03-12",
        "price": 56
    }, {
        "date": "2012-03-13",
        "price": 169
    }, {
        "date": "2012-03-14",
        "price": 24
    }, {
        "date": "2012-03-15",
        "price": 147
    }],
    "valueAxes": [{
        "logarithmic": true,
        "dashLength": 1,
        "guides": [{
            "dashLength": 6,
            "inside": true,
            "label": "average",
            "lineAlpha": 1,
            "value": 90.4
        }],
        "position": "left"
    }],
    "graphs": [{
        "bullet": "round",
        "id": "g1",
        "bulletBorderAlpha": 1,
        "bulletColor": "#FFFFFF",
        "bulletSize": 7,
        "lineThickness": 2,
        "title": "Price",
        "type": "smoothedLine",
        "useLineColorForBulletBorder": true,
        "valueField": "price"
    }],
    "chartScrollbar": {},
    "chartCursor": {
        "valueLineEnabled": true,
        "valueLineBalloonEnabled": true,
        "valueLineAlpha": 0.5,
        "fullWidth": true,
        "cursorAlpha": 0.05
    },
    "dataDateFormat": "YYYY-MM-DD",
    "categoryField": "date",
    "categoryAxis": {
        "parseDates": true
    },
    "export": {
        "enabled": true
    }
});

chart.addListener("dataUpdated", zoomChart);

function zoomChart() {
    chart.zoomToDates(new Date(2012, 2, 2), new Date(2012, 2, 10));
}
</script>

<!-- HTML -->
<div id="chartdiv"></div>