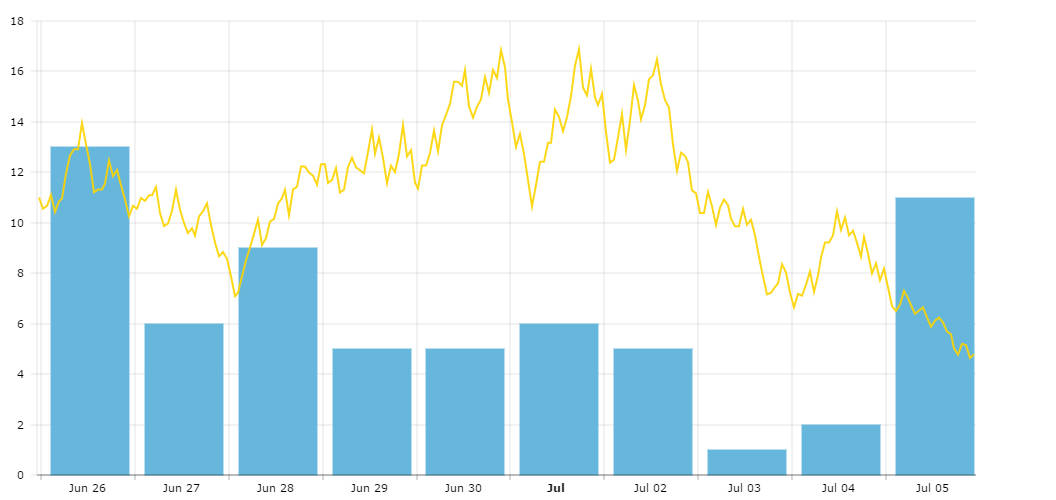
Mixed daily and intra-day chart
You can mix different data of different periods in our charts. Be it line graphs or column graphs, it is all done very easily.
Demo source
<!-- Styles -->
<style>
#chartdiv {
	width		: 100%;
	height		: 500px;
	font-size	: 11px;
}
</style>

<!-- Resources -->
<script src="https://www.amcharts.com/lib/3/amcharts.js"></script>
<script src="https://www.amcharts.com/lib/3/serial.js"></script>
<script src="https://www.amcharts.com/lib/3/plugins/export/export.min.js"></script>
<link rel="stylesheet" href="https://www.amcharts.com/lib/3/plugins/export/export.css" type="text/css" media="all" />

<!-- Chart code -->
<script>
// generate data
var chartData = [];

function generateChartData() {
    var firstDate = new Date();
    firstDate.setTime(firstDate.getTime() - 10 * 24 * 60 * 60 * 1000);

    for (var i = firstDate.getTime(); i < (firstDate.getTime() + 10 * 24 * 60 * 60 * 1000); i += 60 * 60 * 1000) {
        var newDate = new Date(i);

        if (i == firstDate.getTime()) {
            var value1 = Math.round(Math.random() * 10) + 1;
        } else {
            var value1 = Math.round(chartData[chartData.length - 1].value1 / 100 * (90 + Math.round(Math.random() * 20)) * 100) / 100;
        }

        if (newDate.getHours() == 12) {
            // we set daily data on 12th hour only
            var value2 = Math.round(Math.random() * 12) + 1;
            chartData.push({
                date: newDate,
                value1: value1,
                value2: value2
            });
        } else {
            chartData.push({
                date: newDate,
                value1: value1
            });
        }
    }
}

generateChartData();

var chart = AmCharts.makeChart("chartdiv", {
    "type": "serial",
    "theme": "none",
    "marginRight": 80,
    "dataProvider": chartData,
    "valueAxes": [{
        "axisAlpha": 0.1
    }],

    "graphs": [{
        "balloonText": "[[title]]: [[value]]",
        "columnWidth": 20,
        "fillAlphas": 1,
        "title": "daily",
        "type": "column",
        "valueField": "value2"
    }, {
        "balloonText": "[[title]]: [[value]]",
        "lineThickness": 2,
        "title": "intra-day",
        "valueField": "value1"
    }],
    "zoomOutButtonRollOverAlpha": 0.15,
    "chartCursor": {
        "categoryBalloonDateFormat": "MMM DD JJ:NN",
        "cursorPosition": "mouse",
        "showNextAvailable": true
    },
    "autoMarginOffset": 5,
    "columnWidth": 1,
    "categoryField": "date",
    "categoryAxis": {
        "minPeriod": "hh",
        "parseDates": true
    },
    "export": {
        "enabled": true
    }
});
</script>

<!-- HTML -->
<div id="chartdiv"></div>