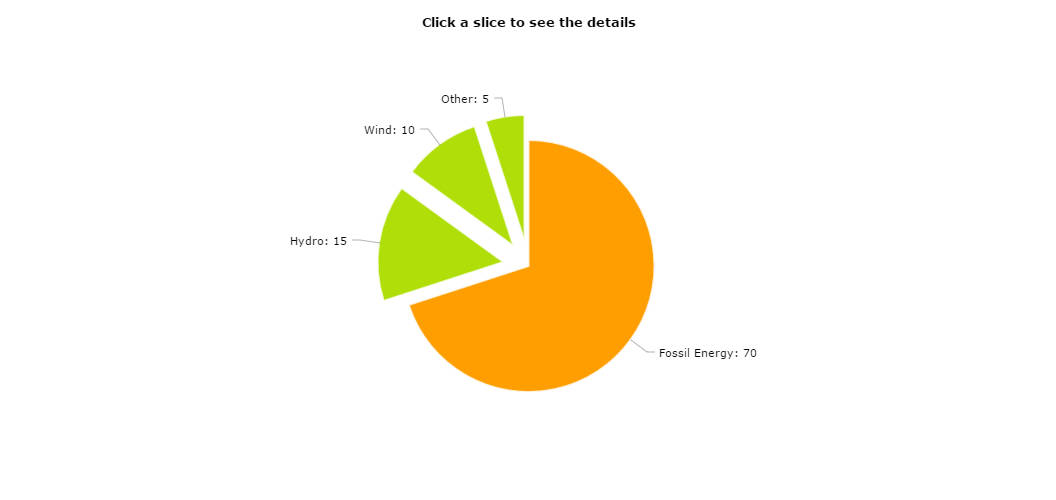
Pie chart with broken down slices
Click on any slice of a chart – it will split into several slices. You can have drill-down pie charts like this with our charts.
Demo source
<!-- Styles -->
<style>
#chartdiv {
  width: 100%;
  height: 500px;
}
</style>

<!-- Resources -->
<script src="https://www.amcharts.com/lib/3/amcharts.js"></script>
<script src="https://www.amcharts.com/lib/3/pie.js"></script>
<script src="https://www.amcharts.com/lib/3/plugins/export/export.min.js"></script>
<link rel="stylesheet" href="https://www.amcharts.com/lib/3/plugins/export/export.css" type="text/css" media="all" />

<!-- Chart code -->
<script>
var chart;
var legend;
var selected;

var types = [{
  type: "Fossil Energy",
  percent: 70,
  color: "#ff9e01",
  subs: [{
    type: "Oil",
    percent: 15
  }, {
    type: "Coal",
    percent: 35
  }, {
    type: "Nuclear",
    percent: 20
  }]
}, {
  type: "Green Energy",
  percent: 30,
  color: "#b0de09",
  subs: [{
    type: "Hydro",
    percent: 15
  }, {
    type: "Wind",
    percent: 10
  }, {
    type: "Other",
    percent: 5
  }]
}];

function generateChartData() {
  var chartData = [];
  for (var i = 0; i < types.length; i++) {
    if (i == selected) {
      for (var x = 0; x < types[i].subs.length; x++) {
        chartData.push({
          type: types[i].subs[x].type,
          percent: types[i].subs[x].percent,
          color: types[i].color,
          pulled: true
        });
      }
    } else {
      chartData.push({
        type: types[i].type,
        percent: types[i].percent,
        color: types[i].color,
        id: i
      });
    }
  }
  return chartData;
}

AmCharts.makeChart("chartdiv", {
  "type": "pie",
"theme": "none",

  "dataProvider": generateChartData(),
  "labelText": "[[title]]: [[value]]",
  "balloonText": "[[title]]: [[value]]",
  "titleField": "type",
  "valueField": "percent",
  "outlineColor": "#FFFFFF",
  "outlineAlpha": 0.8,
  "outlineThickness": 2,
  "colorField": "color",
  "pulledField": "pulled",
  "titles": [{
    "text": "Click a slice to see the details"
  }],
  "listeners": [{
    "event": "clickSlice",
    "method": function(event) {
      var chart = event.chart;
      if (event.dataItem.dataContext.id != undefined) {
        selected = event.dataItem.dataContext.id;
      } else {
        selected = undefined;
      }
      chart.dataProvider = generateChartData();
      chart.validateData();
    }
  }],
  "export": {
    "enabled": true
  }
});
</script>

<!-- HTML -->
<div id="chartdiv"></div>