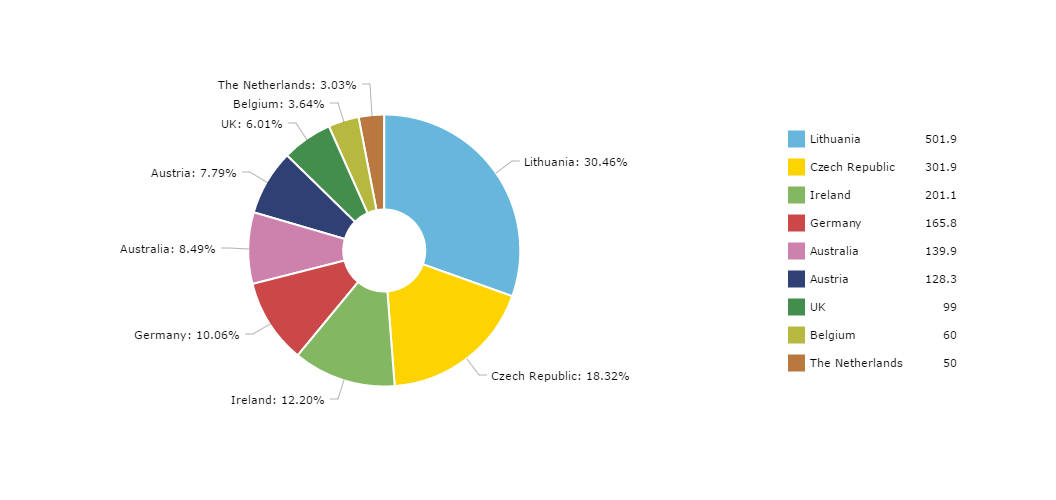
Pie Chart With Legend
Pie chart can display titles and values of slices in the legend. Our legend has a great feature – if you click on legend entry, the slice will be hidden or shown. This might gives additional value for data analysis, as when hidden, slice is excluded when calculating percent values. The position of legend can be easily adjusted.
Demo source
<!-- Styles -->
<style>
#chartdiv {
  width: 100%;
  height: 500px;
  font-size: 11px;
}

.amcharts-pie-slice {
  transform: scale(1);
  transform-origin: 50% 50%;
  transition-duration: 0.3s;
  transition: all .3s ease-out;
  -webkit-transition: all .3s ease-out;
  -moz-transition: all .3s ease-out;
  -o-transition: all .3s ease-out;
  cursor: pointer;
  box-shadow: 0 0 30px 0 #000;
}

.amcharts-pie-slice:hover {
  transform: scale(1.1);
  filter: url(#shadow);
}
</style>

<!-- Resources -->
<script src="https://www.amcharts.com/lib/3/amcharts.js"></script>
<script src="https://www.amcharts.com/lib/3/pie.js"></script>
<script src="https://www.amcharts.com/lib/3/plugins/export/export.min.js"></script>
<link rel="stylesheet" href="https://www.amcharts.com/lib/3/plugins/export/export.css" type="text/css" media="all" />

<!-- Chart code -->
<script>
var chart = AmCharts.makeChart("chartdiv", {
  "type": "pie",
  "startDuration": 0,
   "theme": "none",
  "addClassNames": true,
  "legend":{
   	"position":"right",
    "marginRight":100,
    "autoMargins":false
  },
  "innerRadius": "30%",
  "defs": {
    "filter": [{
      "id": "shadow",
      "width": "200%",
      "height": "200%",
      "feOffset": {
        "result": "offOut",
        "in": "SourceAlpha",
        "dx": 0,
        "dy": 0
      },
      "feGaussianBlur": {
        "result": "blurOut",
        "in": "offOut",
        "stdDeviation": 5
      },
      "feBlend": {
        "in": "SourceGraphic",
        "in2": "blurOut",
        "mode": "normal"
      }
    }]
  },
  "dataProvider": [{
    "country": "Lithuania",
    "litres": 501.9
  }, {
    "country": "Czech Republic",
    "litres": 301.9
  }, {
    "country": "Ireland",
    "litres": 201.1
  }, {
    "country": "Germany",
    "litres": 165.8
  }, {
    "country": "Australia",
    "litres": 139.9
  }, {
    "country": "Austria",
    "litres": 128.3
  }, {
    "country": "UK",
    "litres": 99
  }, {
    "country": "Belgium",
    "litres": 60
  }, {
    "country": "The Netherlands",
    "litres": 50
  }],
  "valueField": "litres",
  "titleField": "country",
  "export": {
    "enabled": true
  }
});

chart.addListener("init", handleInit);

chart.addListener("rollOverSlice", function(e) {
  handleRollOver(e);
});

function handleInit(){
  chart.legend.addListener("rollOverItem", handleRollOver);
}

function handleRollOver(e){
  var wedge = e.dataItem.wedge.node;
  wedge.parentNode.appendChild(wedge);
}
</script>

<!-- HTML -->
<div id="chartdiv"></div>