Polar Scatter
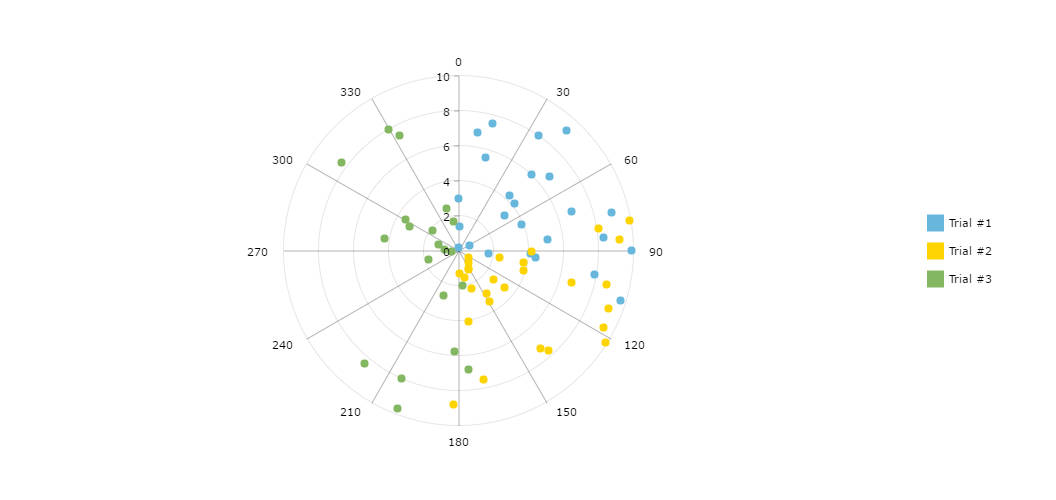
This demo utilizes Radar chart type and Polar Scatter plugin to display a circular scatter chart.
Demo source
<!-- Styles -->
<style>
#chartdiv {
  width: 100%;
  height: 500px;
}
</style>

<!-- Resources -->
<script src="https://www.amcharts.com/lib/3/amcharts.js"></script>
<script src="https://www.amcharts.com/lib/3/radar.js"></script>
<script src="https://www.amcharts.com/lib/3/plugins/tools/polarScatter/polarScatter.min.js"></script>
<script src="https://www.amcharts.com/lib/3/plugins/export/export.min.js"></script>
<link rel="stylesheet" href="https://www.amcharts.com/lib/3/plugins/export/export.css" type="text/css" media="all" />

<!-- Chart code -->
<script>
/**
 * Create the chart
 * Uses amCharts Polar Scatter plugin:
 * https://github.com/amcharts/tools/tree/master/polarScatter
 */
var chart = AmCharts.makeChart("chartdiv", {
  "type": "radar",
  "theme": "none",
  "dataProvider": [],
  "valueAxes": [{
    "gridType": "circles",
    "minimum": 0
  }],
  "startDuration": 1,
  "polarScatter": {
    "minimum": 0,
    "maximum": 359,
    "step": 1
  },
  "legend": {
    "position": "right"
  },
  "graphs": [{
    "title": "Trial #1",
    "balloonText": "[[category]]: [[value]] m/s",
    "bullet": "round",
    "lineAlpha": 0,
    "series": [[83,5.1],[44,5.8],[76,9],[2,1.4],[100,8.3],[96,1.7],[68,3.9],[0,3],[100,4.1],[16,5.5],[71,6.8],[100,7.9],[9,6.8],[85,8.3],[51,6.7],[95,3.8],[95,4.4],[1,0.2],[107,9.7],[50,4.2],[42,9.2],[35,8],[44,6],[64,0.7],[53,3.3],[92,4.1],[43,7.3],[15,7.5],[43,4.3],[90,9.9]]
  }, {
    "title": "Trial #2",
    "balloonText": "[[category]]: [[value]] m/s",
    "bullet": "round",
    "lineAlpha": 0,
    "series": [[178,1.3],[129,3.4],[99,2.4],[80,9.9],[118,9.4],[103,8.7],[91,4.2],[151,1.2],[168,5.2],[168,1.6],[152,1.2],[149,3.4],[182,8.8],[106,6.7],[111,9.2],[130,6.3],[147,2.9],[81,8.1],[138,7.7],[107,3.9],[124,0.7],[130,2.6],[86,9.2],[169,7.5],[122,9.9],[100,3.8],[172,4.1],[140,7.3],[161,2.3],[141,0.9]]
  }, {
    "title": "Trial #3",
    "balloonText": "[[category]]: [[value]] m/s",
    "bullet": "round",
    "lineAlpha": 0,
    "series": [[419,4.9],[417,5.5],[434,0.1],[344,2.5],[279,7.5],[307,8.4],[279,9],[220,8.4],[204,8],[446,0.9],[397,8.9],[351,1.7],[393,0.7],[254,1.8],[260,0.4],[300,3.5],[199,2.7],[182,5.8],[173,2],[201,9.7],[288,1.2],[333,7.4],[308,1.9],[330,8],[408,1.7],[274,0.8],[296,3.1],[279,4.3],[379,5.6],[175,6.8]]
  }],
  "export": {
    "enabled": true
  }
});
</script>

<!-- HTML -->
<div id="chartdiv"></div>