Pyramid Chart
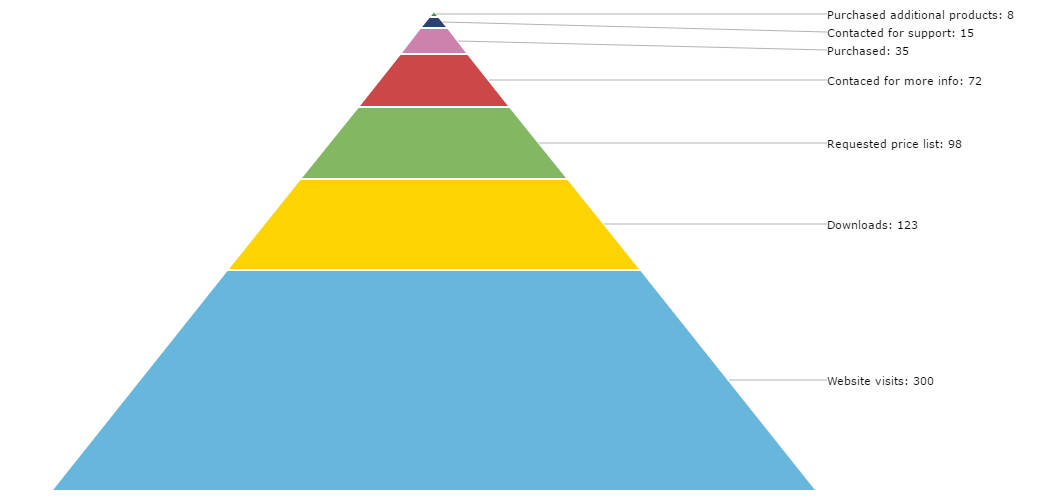
Pyramid chart is just a reversed Funnel chart with no neck. To make this chart, you simply create AmFunnelChart and set “rotate”:true. By default, the height of a slice represents it’s value. However you might want the area of a slice to represent value. In this case you should add “valueRepresents”:”area” property to the chart’s config.
Demo source
<!-- Styles -->
<style>
#chartdiv {
	width		: 100%;
	height		: 500px;
	font-size	: 11px;
}
</style>

<!-- Resources -->
<script src="https://www.amcharts.com/lib/3/amcharts.js"></script>
<script src="https://www.amcharts.com/lib/3/funnel.js"></script>
<script src="https://www.amcharts.com/lib/3/plugins/export/export.min.js"></script>
<link rel="stylesheet" href="https://www.amcharts.com/lib/3/plugins/export/export.css" type="text/css" media="all" />

<!-- Chart code -->
<script>
var chart = AmCharts.makeChart( "chartdiv", {
  "type": "funnel",
  "theme": "none",
  "dataProvider": [ {
    "title": "Website visits",
    "value": 300
  }, {
    "title": "Downloads",
    "value": 123
  }, {
    "title": "Requested price list",
    "value": 98
  }, {
    "title": "Contaced for more info",
    "value": 72
  }, {
    "title": "Purchased",
    "value": 35
  }, {
    "title": "Contacted for support",
    "value": 15
  }, {
    "title": "Purchased additional products",
    "value": 8
  } ],
  "balloon": {
    "fixedPosition": true
  },
  "valueField": "value",
  "titleField": "title",
  "marginRight": 240,
  "marginLeft": 50,
  "startX": -500,
  "rotate": true,
  "labelPosition": "right",
  "balloonText": "[[title]]: [[value]]n[[description]]",
  "export": {
    "enabled": true
  }
} );
</script>

<!-- HTML -->
<div id="chartdiv"></div>