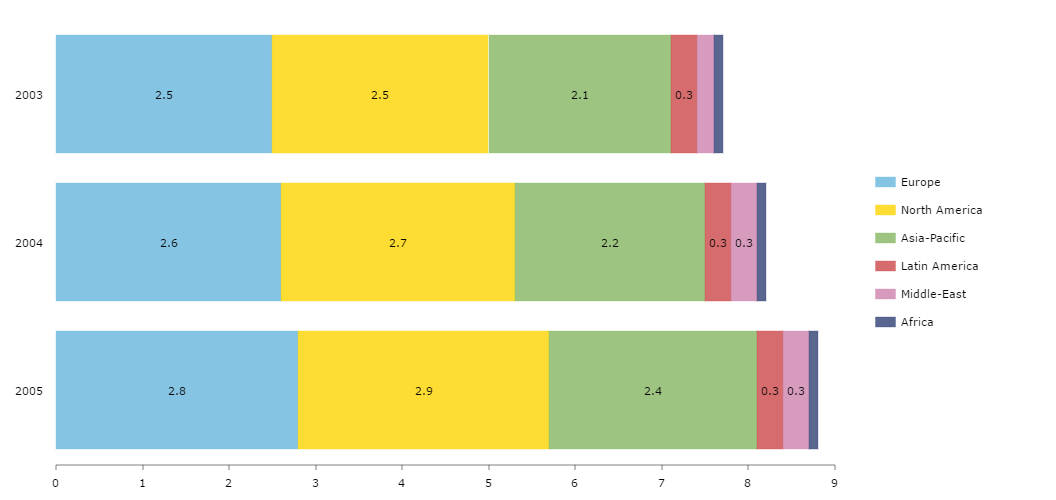
Stacked Bar Chart
Technically, this chart is exactly the same as Stacked Column Chart with a single property, rotate set to true. Our charts do rotate that easily!
HTML in the tool-tip
If you roll-over any column, you will see a nicely formatted text in the tool-tip. Our tool-tips allow any HTML text so you can format the text in any way you want, add images or other HTML elements.
Demo source
<!-- Styles -->
<style>
#chartdiv {
	width		: 100%;
	height		: 500px;
	font-size	: 11px;
}
</style>

<!-- Resources -->
<script src="https://www.amcharts.com/lib/3/amcharts.js"></script>
<script src="https://www.amcharts.com/lib/3/serial.js"></script>
<script src="https://www.amcharts.com/lib/3/plugins/export/export.min.js"></script>
<link rel="stylesheet" href="https://www.amcharts.com/lib/3/plugins/export/export.css" type="text/css" media="all" />

<!-- Chart code -->
<script>
var chart = AmCharts.makeChart("chartdiv", {
    "type": "serial",
	"theme": "none",
    "legend": {
        "horizontalGap": 10,
        "maxColumns": 1,
        "position": "right",
		"useGraphSettings": true,
		"markerSize": 10
    },
    "dataProvider": [{
        "year": 2003,
        "europe": 2.5,
        "namerica": 2.5,
        "asia": 2.1,
        "lamerica": 0.3,
        "meast": 0.2,
        "africa": 0.1
    }, {
        "year": 2004,
        "europe": 2.6,
        "namerica": 2.7,
        "asia": 2.2,
        "lamerica": 0.3,
        "meast": 0.3,
        "africa": 0.1
    }, {
        "year": 2005,
        "europe": 2.8,
        "namerica": 2.9,
        "asia": 2.4,
        "lamerica": 0.3,
        "meast": 0.3,
        "africa": 0.1
    }],
    "valueAxes": [{
        "stackType": "regular",
        "axisAlpha": 0.5,
        "gridAlpha": 0
    }],
    "graphs": [{
        "balloonText": "<b>[[title]]</b><br><span style='font-size:14px'>[[category]]: <b>[[value]]</b></span>",
        "fillAlphas": 0.8,
        "labelText": "[[value]]",
        "lineAlpha": 0.3,
        "title": "Europe",
        "type": "column",
		"color": "#000000",
        "valueField": "europe"
    }, {
        "balloonText": "<b>[[title]]</b><br><span style='font-size:14px'>[[category]]: <b>[[value]]</b></span>",
        "fillAlphas": 0.8,
        "labelText": "[[value]]",
        "lineAlpha": 0.3,
        "title": "North America",
        "type": "column",
		"color": "#000000",
        "valueField": "namerica"
    }, {
        "balloonText": "<b>[[title]]</b><br><span style='font-size:14px'>[[category]]: <b>[[value]]</b></span>",
        "fillAlphas": 0.8,
        "labelText": "[[value]]",
        "lineAlpha": 0.3,
        "title": "Asia-Pacific",
        "type": "column",
		"color": "#000000",
        "valueField": "asia"
    }, {
        "balloonText": "<b>[[title]]</b><br><span style='font-size:14px'>[[category]]: <b>[[value]]</b></span>",
        "fillAlphas": 0.8,
        "labelText": "[[value]]",
        "lineAlpha": 0.3,
        "title": "Latin America",
        "type": "column",
		"color": "#000000",
        "valueField": "lamerica"
    }, {
        "balloonText": "<b>[[title]]</b><br><span style='font-size:14px'>[[category]]: <b>[[value]]</b></span>",
        "fillAlphas": 0.8,
        "labelText": "[[value]]",
        "lineAlpha": 0.3,
        "title": "Middle-East",
        "type": "column",
		"color": "#000000",
        "valueField": "meast"
    }, {
        "balloonText": "<b>[[title]]</b><br><span style='font-size:14px'>[[category]]: <b>[[value]]</b></span>",
        "fillAlphas": 0.8,
        "labelText": "[[value]]",
        "lineAlpha": 0.3,
        "title": "Africa",
        "type": "column",
		"color": "#000000",
        "valueField": "africa"
    }],
    "rotate": true,
    "categoryField": "year",
    "categoryAxis": {
        "gridPosition": "start",
        "axisAlpha": 0,
        "gridAlpha": 0,
        "position": "left"
    },
    "export": {
    	"enabled": true
     }
});
</script>

<!-- HTML -->
<div id="chartdiv"></div>