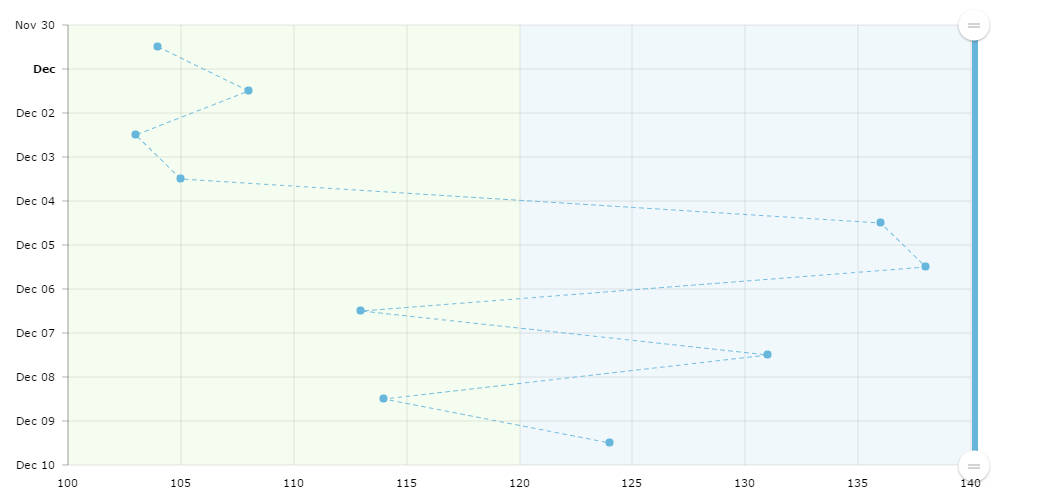
Vertical Line Chart
Using Serial chart, you can have rotated or vertical line chart by setting a single property rotate to true. And of course, this chart can have any categories on category axis – both dates and strings.
Fill plot area with colors
You can fill plot area with both horizontal or vertical fills using Guides.
Demo source
<!-- Styles -->
<style>
#chartdiv {
	width	: 100%;
	height	: 500px;
}
</style>

<!-- Resources -->
<script src="https://www.amcharts.com/lib/3/amcharts.js"></script>
<script src="https://www.amcharts.com/lib/3/serial.js"></script>
<script src="https://www.amcharts.com/lib/3/plugins/export/export.min.js"></script>
<link rel="stylesheet" href="https://www.amcharts.com/lib/3/plugins/export/export.css" type="text/css" media="all" />

<!-- Chart code -->
<script>
var chart = AmCharts.makeChart("chartdiv", {
    "type": "serial",
    "theme": "none",
    "marginRight":80,
    "marginTop":24,
    "dataDateFormat":"YYYY-MM-DD",
    "rotate": true,
    "dataProvider": [{
        "date": "2013-11-30",
        "value": 104
    }, {
        "date": "2013-12-01",
        "value": 108
    }, {
        "date": "2013-12-02",
        "value": 103
    }, {
        "date": "2013-12-03",
        "value": 105
    }, {
        "date": "2013-12-04",
        "value": 136
    }, {
        "date": "2013-12-05",
        "value": 138
    }, {
        "date": "2013-12-06",
        "value": 113
    }, {
        "date": "2013-12-07",
        "value": 131
    }, {
        "date": "2013-12-08",
        "value": 114
    }, {
        "date": "2013-12-09",
        "value": 124
    }],
    "valueAxes": [{
        "maximum": 140,
        "minimum": 100,
        "axisAlpha": 0,
        "guides": [{
            "fillAlpha": 0.1,
            "fillColor": "#99dc67",
            "lineAlpha": 0,
            "toValue": 120,
            "value": 0
        }, {
            "fillAlpha": 0.1,
            "fillColor": "#67b7dc",
            "lineAlpha": 0,
            "toValue": 200,
            "value": 120
        }]
    }],
    "graphs": [{
        "bullet": "round",
        "dashLength": 4,
        "valueField": "value"
    }],
    "chartCursor": {
        "cursorAlpha": 0,
        "categoryBalloonEnabled": false
    },
    "categoryField": "date",
    "categoryAxis": {
        "parseDates": true
    },
    "chartScrollbar":{
        "scrollbarHeight":5,
        "backgroundAlpha":0.1,
        "backgroundColor":"#868686",
        "selectedBackgroundColor":"#67b7dc",
        "selectedBackgroundAlpha":1
    },
    "export": {
        "enabled": true
     }
});
</script>

<!-- HTML -->
<div id="chartdiv"></div>