JavaScript ...
<style >
#chartdiv {
width : 100% ;
height : 500px ;
}
</style >
<script src ="https://www.amcharts.com/lib/3/amcharts.js" > </script >
<script src ="https://www.amcharts.com/lib/3/xy.js" > </script >
<script src ="https://www.amcharts.com/lib/3/plugins/export/export.min.js" > </script >
<link rel ="stylesheet" href ="https://www.amcharts.com/lib/3/plugins/export/export.css" type ="text/css" media ="all" />
<script >
var chart = AmCharts .makeChart ("chartdiv" , {
"type" : "xy" ,
"theme" : "none" ,
"marginRight" : 80 ,
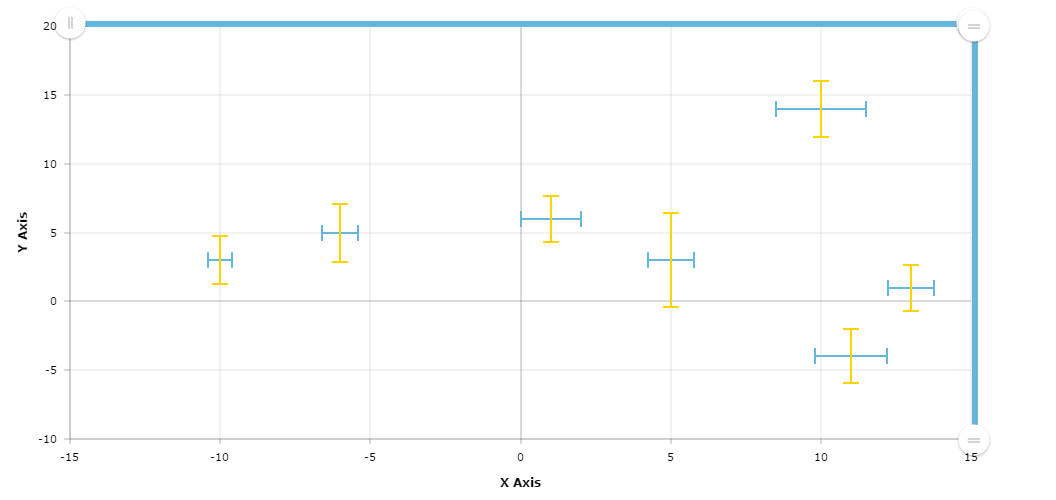
"dataProvider" : [{
"x" : 10 ,
"y" : 14 ,
"errorX" : 3 ,
"errorY" : 4
}, {
"x" : 5 ,
"y" : 3 ,
"errorX" : 1.52 ,
"errorY" : 6.8
}, {
"x" : -10 ,
"y" : 3 ,
"errorX" : 0.8 ,
"errorY" : 3.5
}, {
"x" : -6 ,
"y" : 5 ,
"errorX" : 1.2 ,
"errorY" : 4.2
}, {
"x" : 11 ,
"y" : -4 ,
"errorX" : 2.4 ,
"errorY" : 3.9
}, {
"x" : 13 ,
"y" : 1 ,
"errorX" : 1.5 ,
"errorY" : 3.3
}, {
"x" : 1 ,
"y" : 6 ,
"errorX" : 2 ,
"errorY" : 3.3
}],
"valueAxes" : [{
"title" : "X Axis" ,
"position" : "bottom" ,
"id" : "x1"
}, {
"minMaxMultiplier" : 1.2 ,
"position" : "left" ,
"id" : "y1" ,
"title" : "Y Axis"
}],
"graphs" : [{
"balloonText" : "x:<b>[[x]]</b> y:<b>[[y]]</b><br>x error:<b>[[errorX]]</b><br>y error:<b>[[errorY]]</b>" ,
"bullet" : "xError" ,
"bulletAxis" : "x1" ,
"errorField" : "errorX" ,
"lineAlpha" : 0 ,
"xField" : "x" ,
"yField" : "y" ,
"fillAlphas" : 0
}, {
"balloonText" : "x:<b>[[x]]</b> y:<b>[[y]]</b><br>x error:<b>[[errorX]]</b><br>y error:<b>[[errorY]]</b>" ,
"bullet" : "yError" ,
"bulletAxis" : "y1" ,
"errorField" : "errorY" ,
"lineAlpha" : 0 ,
"xField" : "x" ,
"yField" : "y" ,
"fillAlphas" : 0
}],
"chartScrollbar" : {
"scrollbarHeight" : 5 ,
"backgroundAlpha" : 0.1 ,
"backgroundColor" : "#868686" ,
"selectedBackgroundColor" : "#67b7dc" ,
"selectedBackgroundAlpha" : 1
},
"export" : {
"enabled" : true
}
});
</script >
<div id ="chartdiv" > </div >