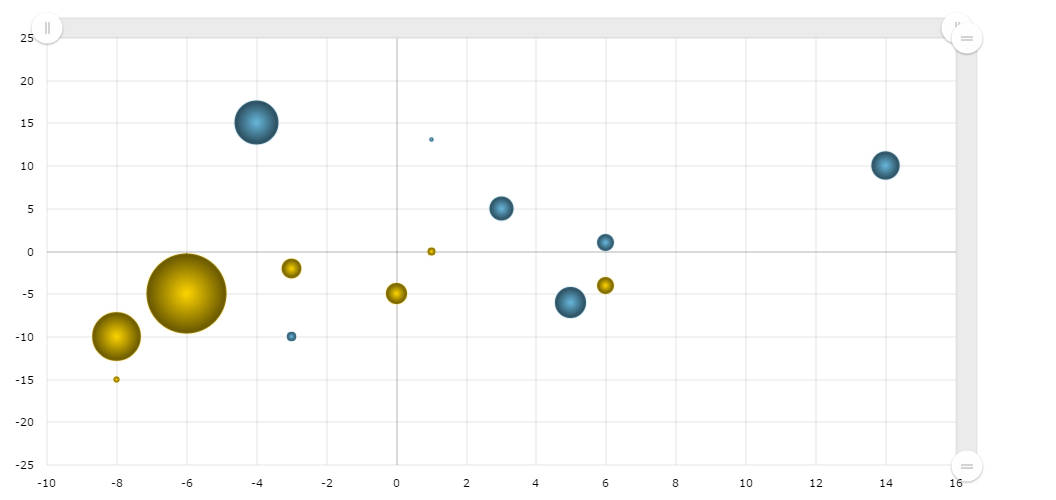
Zoomable Bubble Chart
Our Bubble/XY chart can be zoomed-in and scrolled. Have you seen this anywhere else? Try to select some area of the chart – it will be zoomed-in. And even more – you can disable zooming and use the cursor just to mark some area on the chart. If you need to find values of the selection, check this tutorial: Detecting at what value mouse pointer is. By the way – it is even possible to bound the size of the bullets to value axis – they will change size when zooming in this case.
Demo source
<!-- Styles -->
<style>
#chartdiv {
	width	: 100%;
	height	: 500px;
}
</style>

<!-- Resources -->
<script src="https://www.amcharts.com/lib/3/amcharts.js"></script>
<script src="https://www.amcharts.com/lib/3/xy.js"></script>
<script src="https://www.amcharts.com/lib/3/plugins/export/export.min.js"></script>
<link rel="stylesheet" href="https://www.amcharts.com/lib/3/plugins/export/export.css" type="text/css" media="all" />

<!-- Chart code -->
<script>
 var chart = AmCharts.makeChart("chartdiv", {
     "type": "xy",
     "theme": "none",
     "marginRight": 80,
     "marginTop": 17,
     "dataProvider": [{
         "y": 10,
         "x": 14,
         "value": 59,
         "y2": -5,
         "x2": 0,
         "value2": 44
     }, {
         "y": 5,
         "x": 3,
         "value": 50,
         "y2": -15,
         "x2": -8,
         "value2": 12
     }, {
         "y": -10,
         "x": -3,
         "value": 19,
         "y2": -4,
         "x2": 6,
         "value2": 35
     }, {
         "y": -6,
         "x": 5,
         "value": 65,
         "y2": -5,
         "x2": -6,
         "value2": 168
     }, {
         "y": 15,
         "x": -4,
         "value": 92,
         "y2": -10,
         "x2": -8,
         "value2": 102
     }, {
         "y": 13,
         "x": 1,
         "value": 8,
         "y2": -2,
         "x2": -3,
         "value2": 41
     }, {
         "y": 1,
         "x": 6,
         "value": 35,
         "y2": 0,
         "x2": 1,
         "value2": 16
     }],
     "valueAxes": [{
         "position": "bottom",
         "axisAlpha": 0
     }, {
         "minMaxMultiplier": 1.2,
         "axisAlpha": 0,
         "position": "left"
     }],
     "startDuration": 1.5,
     "graphs": [{
         "balloonText": "x:<b>[[x]]</b> y:<b>[[y]]</b><br>value:<b>[[value]]</b>",
         "bullet": "bubble",
         "lineAlpha": 0,
         "valueField": "value",
         "xField": "x",
         "yField": "y",
         "fillAlphas": 0,
         "bulletBorderAlpha": 0.2,
         "maxBulletSize": 80

     }, {
         "balloonText": "x:<b>[[x]]</b> y:<b>[[y]]</b><br>value:<b>[[value]]</b>",
         "bullet": "bubble",
         "lineAlpha": 0,
         "valueField": "value2",
         "xField": "x2",
         "yField": "y2",
         "fillAlphas": 0,
         "bulletBorderAlpha": 0.2,
         "maxBulletSize": 80

     }],
     "marginLeft": 46,
     "marginBottom": 35,
     "chartScrollbar": {},
     "chartCursor": {},
     "balloon":{
      "fixedPosition":true
     },
     "export": {
         "enabled": true
     }
 });
</script>

<!-- HTML -->
<div id="chartdiv"></div>