JavaScript TypeScript / ES6 JSON ...
<style >
#chartdiv {
width : 100% ;
height : 500px ;
}
</style >
<script src ="https://cdn.amcharts.com/lib/4/core.js" > </script >
<script src ="https://cdn.amcharts.com/lib/4/charts.js" > </script >
<script src ="https://cdn.amcharts.com/lib/4/themes/animated.js" > </script >
<script >
am4core.ready (function (useTheme (am4themes_animated);
var chart = am4core.create ("chartdiv" , am4charts.XYChart3D );
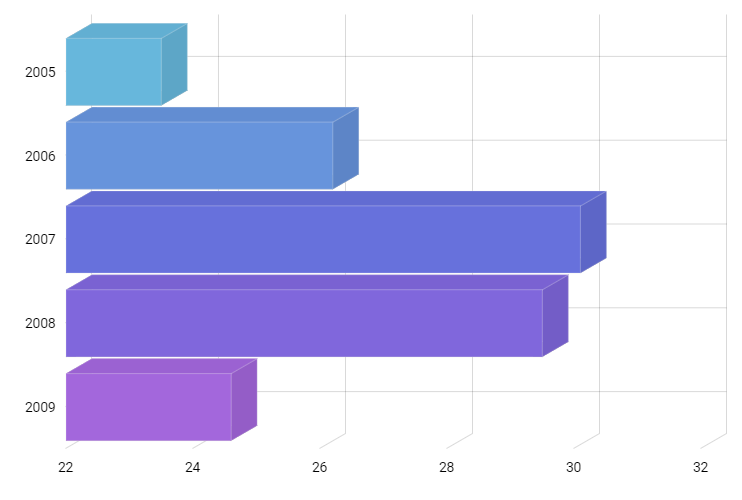
chart.data = [{
"year" : 2005 ,
"income" : 23.5 ,
"color" : chart.colors .next ()
}, {
"year" : 2006 ,
"income" : 26.2 ,
"color" : chart.colors .next ()
}, {
"year" : 2007 ,
"income" : 30.1 ,
"color" : chart.colors .next ()
}, {
"year" : 2008 ,
"income" : 29.5 ,
"color" : chart.colors .next ()
}, {
"year" : 2009 ,
"income" : 24.6 ,
"color" : chart.colors .next ()
}];
var categoryAxis = chart.yAxes .push (new am4charts.CategoryAxis ());
categoryAxis.dataFields .category = "year" ;
categoryAxis.numberFormatter .numberFormat = "#" ;
categoryAxis.renderer .inversed = true ;
var valueAxis = chart.xAxes .push (new am4charts.ValueAxis ());
var series = chart.series .push (new am4charts.ColumnSeries3D ());
series.dataFields .valueX = "income" ;
series.dataFields .categoryY = "year" ;
series.name = "Income" ;
series.columns .template .propertyFields .fill = "color" ;
series.columns .template .tooltipText = "{valueX}" ;
series.columns .template .column3D .stroke = am4core.color ("#fff" );
series.columns .template .column3D .strokeOpacity = 0.2 ;
});
</script >
<div id ="chartdiv" > </div >
import * as am4core from "@amcharts/amcharts4/core" ;
import * as am4charts from "@amcharts/amcharts4/charts" ;
import am4themes_animated from "@amcharts/amcharts4/themes/animated" ;
am4core.useTheme (am4themes_animated);
let chart = am4core.create ("chartdiv" , am4charts.XYChart3D );
chart.data = [{
"year" : 2005 ,
"income" : 23.5 ,
"color" : chart.colors .next ()
}, {
"year" : 2006 ,
"income" : 26.2 ,
"color" : chart.colors .next ()
}, {
"year" : 2007 ,
"income" : 30.1 ,
"color" : chart.colors .next ()
}, {
"year" : 2008 ,
"income" : 29.5 ,
"color" : chart.colors .next ()
}, {
"year" : 2009 ,
"income" : 24.6 ,
"color" : chart.colors .next ()
}];
let categoryAxis = chart.yAxes .push (new am4charts.CategoryAxis ());
categoryAxis.dataFields .category = "year" ;
categoryAxis.numberFormatter .numberFormat = "#" ;
categoryAxis.renderer .inversed = true ;
let valueAxis = chart.xAxes .push (new am4charts.ValueAxis ());
let series = chart.series .push (new am4charts.ColumnSeries3D ());
series.dataFields .valueX = "income" ;
series.dataFields .categoryY = "year" ;
series.name = "Income" ;
series.columns .template .propertyFields .fill = "color" ;
series.columns .template .tooltipText = "{valueX}" ;
series.columns .template .column3D .stroke = am4core.color ("#fff" );
series.columns .template .column3D .strokeOpacity = 0.2 ;
<style >
#chartdiv {
width : 100% ;
height : 500px ;
}
</style >
<script src ="https://cdn.amcharts.com/lib/4/core.js" > </script >
<script src ="https://cdn.amcharts.com/lib/4/charts.js" > </script >
<script src ="https://cdn.amcharts.com/lib/4/themes/animated.js" > </script >
<script >
am4core.useTheme (am4themes_animated);
var chart = am4core.createFromConfig ({
"data" : [{
"year" : 2005 ,
"income" : 23.5 ,
"color" : "#67b7dc"
}, {
"year" : 2006 ,
"income" : 26.2 ,
"color" : "#6794dc"
}, {
"year" : 2007 ,
"income" : 30.1 ,
"color" : "#6771dc"
}, {
"year" : 2008 ,
"income" : 29.5 ,
"color" : "#8067dc"
}, {
"year" : 2009 ,
"income" : 24.6 ,
"color" : "#a367dc"
}],
"xAxes" : [{
"type" : "ValueAxis"
}],
"yAxes" : [{
"type" : "CategoryAxis" ,
"dataFields" : {
"category" : "year"
},
"numberFormatter" : {
"numberFormat" : "#"
},
"renderer" : {
"inversed" : true
}
}],
"series" : [{
"type" : "ColumnSeries3D" ,
"dataFields" : {
"valueX" : "income" ,
"categoryY" : "year"
},
"name" : "Income" ,
"columns" : {
"propertyFields" : {
"fill" : "color"
},
"tooltipText" : "{valueX}" ,
"column3D" : {
"stroke" : "#fff" ,
"strokeOpacity" : 0.2
}
}
}]
}, "chartdiv" , am4charts.XYChart3D );
</script >
<div id ="chartdiv" > </div >