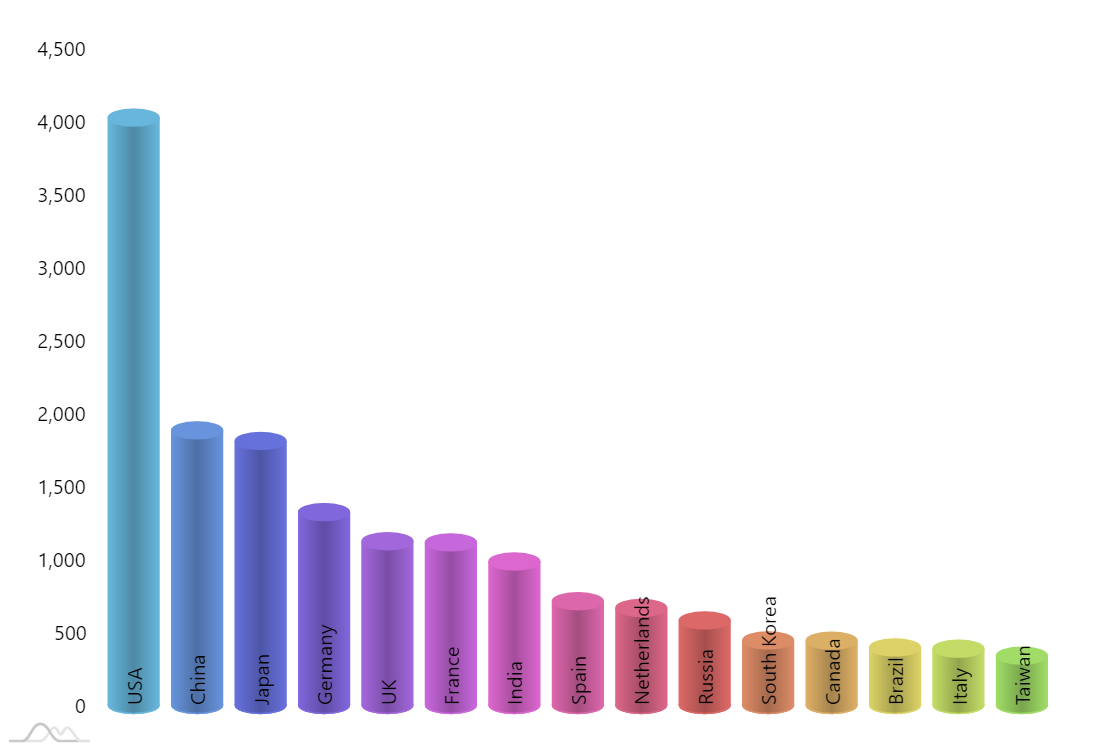
3D Cylinder Chart
amCharts 4 includes a 3D variant of XYChart called XYChart3D. With ConeSeries we can easily create a bar chart with cylinder-like bars.
Demo source
<!-- Styles -->
<style>
#chartdiv {
  width: 100%;
  height: 500px;
}

</style>

<!-- Resources -->
<script src="https://cdn.amcharts.com/lib/4/core.js"></script>
<script src="https://cdn.amcharts.com/lib/4/charts.js"></script>
<script src="https://cdn.amcharts.com/lib/4/themes/animated.js"></script>

<!-- Chart code -->
<script>
am4core.ready(function() {

// Themes begin
am4core.useTheme(am4themes_animated);
// Themes end

// Create chart instance
var chart = am4core.create("chartdiv", am4charts.XYChart3D);
chart.paddingBottom = 30;
chart.angle = 35;

// Add data
chart.data = [{
  "country": "USA",
  "visits": 4025
}, {
  "country": "China",
  "visits": 1882
}, {
  "country": "Japan",
  "visits": 1809
}, {
  "country": "Germany",
  "visits": 1322
}, {
  "country": "UK",
  "visits": 1122
}, {
  "country": "France",
  "visits": 1114
}, {
  "country": "India",
  "visits": 984
}, {
  "country": "Spain",
  "visits": 711
}, {
  "country": "Netherlands",
  "visits": 665
}, {
  "country": "Russia",
  "visits": 580
}, {
  "country": "South Korea",
  "visits": 443
}, {
  "country": "Canada",
  "visits": 441
}, {
  "country": "Brazil",
  "visits": 395
}, {
  "country": "Italy",
  "visits": 386
}, {
  "country": "Taiwan",
  "visits": 338
}];

// Create axes
var categoryAxis = chart.xAxes.push(new am4charts.CategoryAxis());
categoryAxis.dataFields.category = "country";
categoryAxis.renderer.grid.template.location = 0;
categoryAxis.renderer.minGridDistance = 20;
categoryAxis.renderer.inside = true;
categoryAxis.renderer.grid.template.disabled = true;

let labelTemplate = categoryAxis.renderer.labels.template;
labelTemplate.rotation = -90;
labelTemplate.horizontalCenter = "left";
labelTemplate.verticalCenter = "middle";
labelTemplate.dy = 10; // moves it a bit down;
labelTemplate.inside = false; // this is done to avoid settings which are not suitable when label is rotated

var valueAxis = chart.yAxes.push(new am4charts.ValueAxis());
valueAxis.renderer.grid.template.disabled = true;

// Create series
var series = chart.series.push(new am4charts.ConeSeries());
series.dataFields.valueY = "visits";
series.dataFields.categoryX = "country";

var columnTemplate = series.columns.template;
columnTemplate.adapter.add("fill", function(fill, target) {
  return chart.colors.getIndex(target.dataItem.index);
})

columnTemplate.adapter.add("stroke", function(stroke, target) {
  return chart.colors.getIndex(target.dataItem.index);
})

}); // end am4core.ready()
</script>

<!-- HTML -->
<div id="chartdiv"></div>