3D Pie Chart
Making pie chart 3D
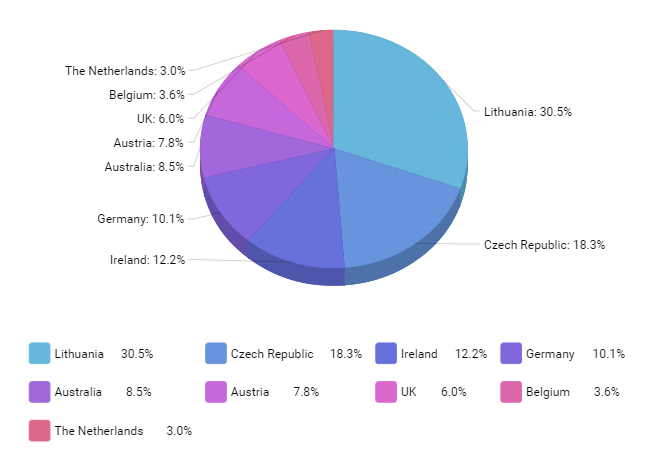
A 3D pie chart is like regular pie chart. They’re identical in configuration, except that the former uses PieChart3D class to instantiate the chart, and PieSeries3D for its series.
It also introduces additional settings depth and angle to configure depth (height) and angle at which we are viewing the chart.
Demo source
<!-- Styles -->
<style>
#chartdiv {
  width: 100%;
  height: 500px;
}

</style>

<!-- Resources -->
<script src="https://cdn.amcharts.com/lib/4/core.js"></script>
<script src="https://cdn.amcharts.com/lib/4/charts.js"></script>
<script src="https://cdn.amcharts.com/lib/4/themes/animated.js"></script>

<!-- Chart code -->
<script>
am4core.ready(function() {

// Themes begin
am4core.useTheme(am4themes_animated);
// Themes end

var chart = am4core.create("chartdiv", am4charts.PieChart3D);
chart.hiddenState.properties.opacity = 0; // this creates initial fade-in

chart.legend = new am4charts.Legend();

chart.data = [
  {
    country: "Lithuania",
    litres: 501.9
  },
  {
    country: "Czech Republic",
    litres: 301.9
  },
  {
    country: "Ireland",
    litres: 201.1
  },
  {
    country: "Germany",
    litres: 165.8
  },
  {
    country: "Australia",
    litres: 139.9
  },
  {
    country: "Austria",
    litres: 128.3
  },
  {
    country: "UK",
    litres: 99
  },
  {
    country: "Belgium",
    litres: 60
  },
  {
    country: "The Netherlands",
    litres: 50
  }
];

var series = chart.series.push(new am4charts.PieSeries3D());
series.dataFields.value = "litres";
series.dataFields.category = "country";

}); // end am4core.ready()
</script>

<!-- HTML -->
<div id="chartdiv"></div>