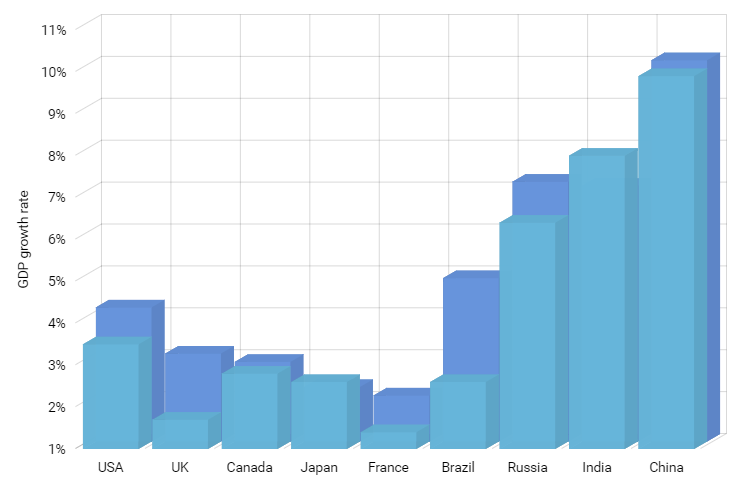
3D Stacked Column Chart
Faux-3D charts may not be the best data representation in terms of comprehension but they are definitely visually appealing in some circumstances. Use your own judgement to decide what’s important in your specific case.
Non-clustered 3D columns
Setting 3D column series clustered property to false will automatically create a “3D stack” effect.
Configurable 3D angle and depth
Chart’s angle and depth properties can be used to set up its perfect 3D appearance.
Demo source
<!-- Styles -->
<style>
#chartdiv {
  width: 100%;
  height: 500px;
}

</style>

<!-- Resources -->
<script src="https://cdn.amcharts.com/lib/4/core.js"></script>
<script src="https://cdn.amcharts.com/lib/4/charts.js"></script>
<script src="https://cdn.amcharts.com/lib/4/themes/animated.js"></script>

<!-- Chart code -->
<script>
am4core.ready(function() {

// Themes begin
am4core.useTheme(am4themes_animated);
// Themes end

// Create chart instance
var chart = am4core.create("chartdiv", am4charts.XYChart3D);

// Add data
chart.data = [{
    "country": "USA",
    "year2017": 3.5,
    "year2018": 4.2
}, {
    "country": "UK",
    "year2017": 1.7,
    "year2018": 3.1
}, {
    "country": "Canada",
    "year2017": 2.8,
    "year2018": 2.9
}, {
    "country": "Japan",
    "year2017": 2.6,
    "year2018": 2.3
}, {
    "country": "France",
    "year2017": 1.4,
    "year2018": 2.1
}, {
    "country": "Brazil",
    "year2017": 2.6,
    "year2018": 4.9
}, {
    "country": "Russia",
    "year2017": 6.4,
    "year2018": 7.2
}, {
    "country": "India",
    "year2017": 8,
    "year2018": 7.1
}, {
    "country": "China",
    "year2017": 9.9,
    "year2018": 10.1
}];

// Create axes
var categoryAxis = chart.xAxes.push(new am4charts.CategoryAxis());
categoryAxis.dataFields.category = "country";
categoryAxis.renderer.grid.template.location = 0;
categoryAxis.renderer.minGridDistance = 30;

var valueAxis = chart.yAxes.push(new am4charts.ValueAxis());
valueAxis.title.text = "GDP growth rate";
valueAxis.renderer.labels.template.adapter.add("text", function(text) {
  return text + "%";
});

// Create series
var series = chart.series.push(new am4charts.ColumnSeries3D());
series.dataFields.valueY = "year2017";
series.dataFields.categoryX = "country";
series.name = "Year 2017";
series.clustered = false;
series.columns.template.tooltipText = "GDP grow in {category} (2017): [bold]{valueY}[/]";
series.columns.template.fillOpacity = 0.9;

var series2 = chart.series.push(new am4charts.ColumnSeries3D());
series2.dataFields.valueY = "year2018";
series2.dataFields.categoryX = "country";
series2.name = "Year 2018";
series2.clustered = false;
series2.columns.template.tooltipText = "GDP grow in {category} (2017): [bold]{valueY}[/]";

}); // end am4core.ready()
</script>

<!-- HTML -->
<div id="chartdiv"></div>