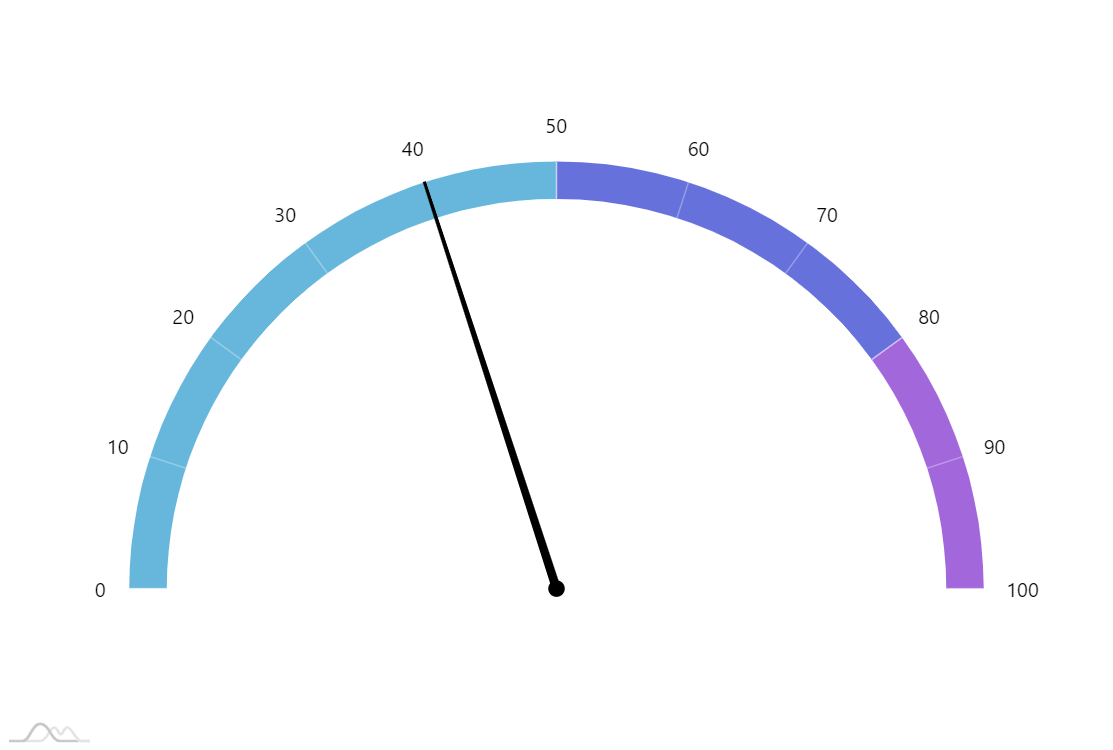
Angular Gauge
Anglular Gauges (also known as Speedometer Chart) are most commonly used to mimic the real-life gauges to display values like volume, temperature, speed, etc.
Demo source
<!-- Styles -->
<style>
#chartdiv {
  width: 100%;
  height: 500px;
}
</style>

<!-- Resources -->
<script src="https://cdn.amcharts.com/lib/4/core.js"></script>
<script src="https://cdn.amcharts.com/lib/4/charts.js"></script>
<script src="https://cdn.amcharts.com/lib/4/themes/animated.js"></script>

<!-- Chart code -->
<script>
am4core.ready(function() {

// Themes begin
am4core.useTheme(am4themes_animated);
// Themes end

// create chart
var chart = am4core.create("chartdiv", am4charts.GaugeChart);
chart.hiddenState.properties.opacity = 0; // this makes initial fade in effect

chart.innerRadius = -25;

var axis = chart.xAxes.push(new am4charts.ValueAxis());
axis.min = 0;
axis.max = 100;
axis.strictMinMax = true;
axis.renderer.grid.template.stroke = new am4core.InterfaceColorSet().getFor("background");
axis.renderer.grid.template.strokeOpacity = 0.3;

var colorSet = new am4core.ColorSet();

var range0 = axis.axisRanges.create();
range0.value = 0;
range0.endValue = 50;
range0.axisFill.fillOpacity = 1;
range0.axisFill.fill = colorSet.getIndex(0);
range0.axisFill.zIndex = - 1;

var range1 = axis.axisRanges.create();
range1.value = 50;
range1.endValue = 80;
range1.axisFill.fillOpacity = 1;
range1.axisFill.fill = colorSet.getIndex(2);
range1.axisFill.zIndex = -1;

var range2 = axis.axisRanges.create();
range2.value = 80;
range2.endValue = 100;
range2.axisFill.fillOpacity = 1;
range2.axisFill.fill = colorSet.getIndex(4);
range2.axisFill.zIndex = -1;

var hand = chart.hands.push(new am4charts.ClockHand());

// using chart.setTimeout method as the timeout will be disposed together with a chart
chart.setTimeout(randomValue, 2000);

function randomValue() {
    hand.showValue(Math.random() * 100, 1000, am4core.ease.cubicOut);
    chart.setTimeout(randomValue, 2000);
}

}); // end am4core.ready()
</script>

<!-- HTML -->
<div id="chartdiv"></div> 