<!-- Styles --><style>#chartdiv {
width: 100%;
height: 600px;
}
</style><!-- Resources --><scriptsrc="https://cdn.amcharts.com/lib/4/core.js"></script><scriptsrc="https://cdn.amcharts.com/lib/4/charts.js"></script><scriptsrc="https://cdn.amcharts.com/lib/4/themes/animated.js"></script><!-- Chart code --><script>
am4core.ready(function() {
// Themes begin
am4core.useTheme(am4themes_animated);
// Themes endvar chart = am4core.create("chartdiv", am4charts.SankeyDiagram);
chart.data = [
// these are just for color, as properties are taken from data object where the name is first mentioned.
{from:"Cash in the U.S.", color:"#f47b20"},
{from:"Cash Overseas", color:"#000000"},
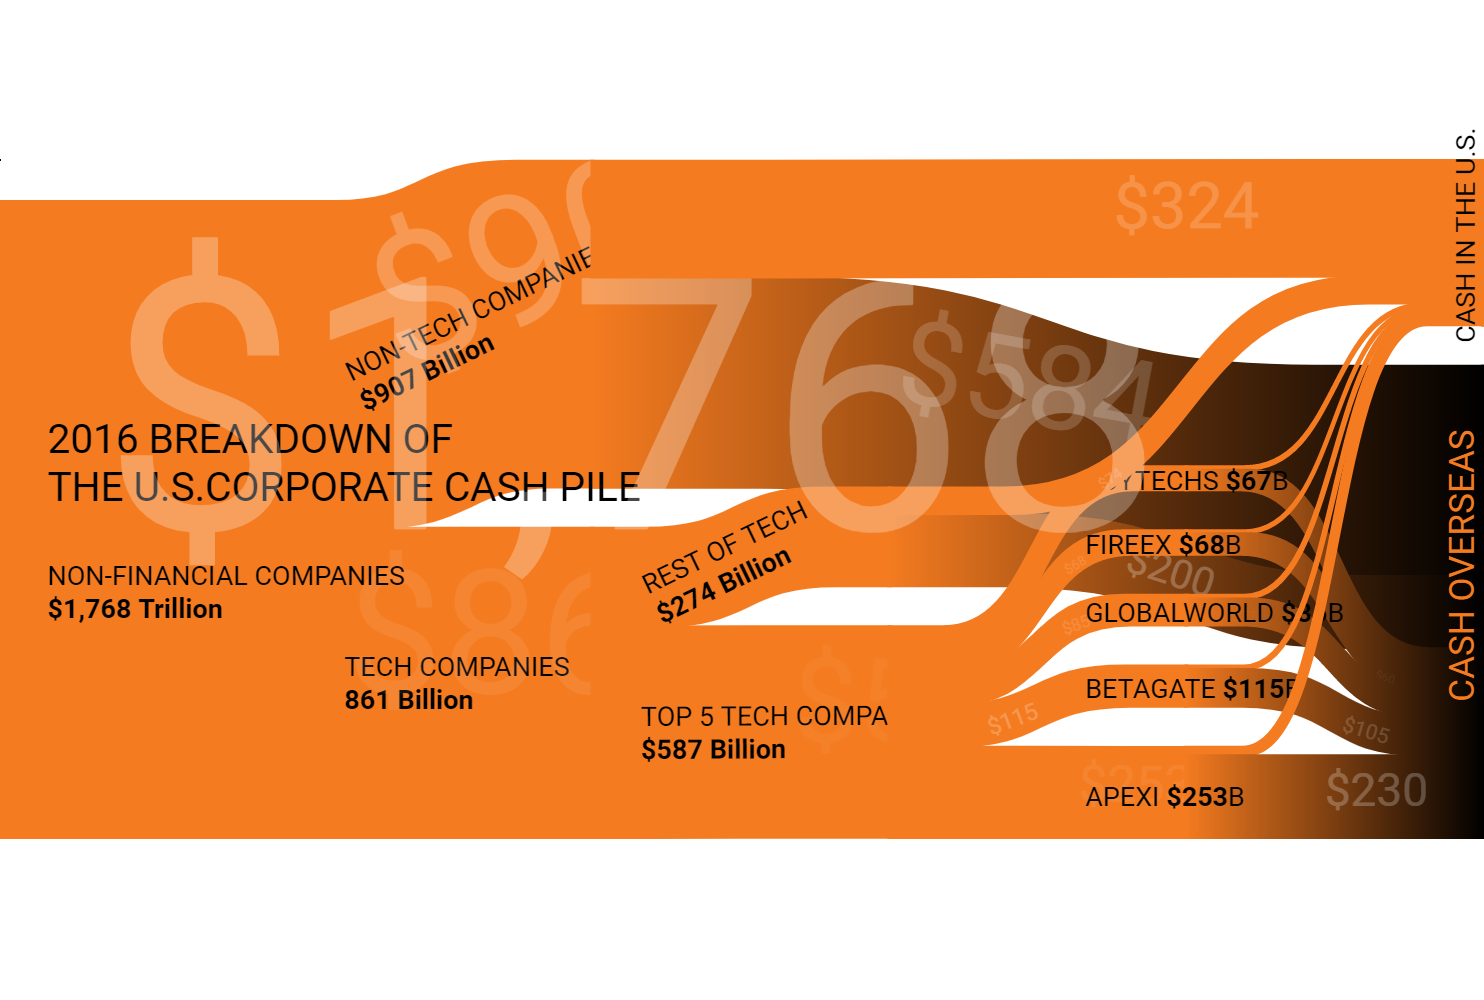
{ from: "Source", to: "Total non financial companies", value: 1768, color: "#f47b20", labelText: "[font-size:1.5em]2016 BREAKDOWN OF\nTHE U.S.CORPORATE CASH PILE\n\n[/]NON-FINANCIAL COMPANIES \n [bold]$1,768 Trillion[/b]", zIndex: 100 },
{ from: "Total non financial companies", to: "Non-tech companies", value: 907, color: "#f47b20", labelText: "NON-TECH COMPANIES\n [bold]$907 Billion[/]" },
{ from: "Total non financial companies", to: "Tech companies", value: 861, color: "#f47b20", labelText: "TECH COMPANIES\n [bold]861 Billion[/]" },
{ from: "Non-tech companies", to: "Cash in the U.S.", value: 324, color: "#f47b20", zIndex: 101 },
{ from: "Non-tech companies", to: "Cash Overseas", value: 584, color: "#f47b20" },
{ from: "Tech companies", to: "Rest of tech", value: 274, color: "#f47b20", labelText: "REST OF TECH\n[bold]$274 Billion[/]" },
{ from: "Tech companies", to: "Top 5 tech companies", value: 587, color: "#f47b20", labelText: "TOP 5 TECH COMPANIES\n[bold]$587 Billion[/]" },
{ from: "Rest of tech", to: "Cash in the U.S.", value: 74, color: "#f47b20", zIndex: 100 },
{ from: "Rest of tech", to: "Cash Overseas", value: 200, color: "#f47b20" },
{ from: "Top 5 tech companies", to: "Joytechs", value: 67, color: "#f47b20" },
{ from: "Joytechs", to: "Cash in the U.S.", value: 10, color: "#f47b20" },
{ from: "Joytechs", to: "Cash Overseas", value: 57, color: "#f47b20", labelText: "JOYTECHS [bold]$67[/]B", labelLocation: 0, labelRotation: 0 },
{ from: "Top 5 tech companies", to: "Fireex", value: 68, color: "#f47b20" },
{ from: "Fireex", to: "Cash in the U.S.", value: 8, color: "#f47b20" },
{ from: "Fireex", to: "Cash Overseas", value: 60, color: "#f47b20", labelText: "FIREEX [bold]$68[/]B", labelLocation: 0, labelRotation: 0 },
{ from: "Top 5 tech companies", to: "Globalworld", value: 85, color: "#f47b20" },
{ from: "Globalworld", to: "Cash in the U.S.", value: 10, color: "#f47b20" },
{ from: "Globalworld", to: "Cash Overseas", value: 75, color: "#f47b20", labelText: "GLOBALWORLD [bold]$85[/]B", labelLocation: 0, labelRotation: 0 },
{ from: "Top 5 tech companies", to: "Betagate", value: 115, color: "#f47b20" },
{ from: "Betagate", to: "Cash in the U.S.", value: 10, color: "#f47b20" },
{ from: "Betagate", to: "Cash Overseas", value: 105, color: "#f47b20", labelText: "BETAGATE [bold]$115[/]B", labelLocation: 0, labelRotation: 0 },
{ from: "Top 5 tech companies", to: "Apexi", value: 253, color: "#f47b20" },
{ from: "Apexi", to: "Cash in the U.S.", value: 23, color: "#f47b20" },
{ from: "Apexi", to: "Cash Overseas", value: 230, color: "#f47b20", labelText: "APEXI [bold]$253[/]B", labelLocation: 0, labelRotation: 0 },
{ from: "Cash in the U.S.", color: "#f47b20", labelRotation: -90, labelText: "CASH IN THE U.S.\n[bold]$460 BILLION", labelLocation: 0, value: 460, zIndex: 102 },
{ from: "Cash Overseas", color: "#000000", labelText: "[#f47b20 font-size:1.3em]CASH OVERSEAS\n[bold #f47b20 font-size:1.3em]$1,31 TRILLION", labelLocation: 0, labelRotation: -90, value: 1310 }
];
chart.paddingRight = 30;
chart.paddingTop = 80;
chart.paddingBottom = 80;
chart.nodeAlign = "bottom";
chart.minNodeSize = 0.001;
chart.dataFields.fromName = "from";
chart.dataFields.toName = "to";
chart.dataFields.value = "value";
chart.dataFields.color = "color";
var linkTemplate = chart.links.template;
linkTemplate.colorMode = "gradient";
linkTemplate.fillOpacity = 1;
linkTemplate.strokeOpacity = 1;
linkTemplate.cursorOverStyle = am4core.MouseCursorStyle.pointer;
linkTemplate.readerTitle = "drag me!";
linkTemplate.showSystemTooltip = true;
linkTemplate.tooltipText = "";
linkTemplate.propertyFields.zIndex = "zIndex";
linkTemplate.tension = 0.6;
chart.nodes.template.width = 0;
chart.nodes.template.nameLabel.disabled = true;
chart.nodes.template.draggable = true;
chart.nodes.template.inert = true;
chart.nodes.template.togglable = false;
// making links draggable
linkTemplate.events.on("down", function (event) {
var fromNode = event.target.dataItem.fromNode;
var toNode = event.target.dataItem.toNode;
var distanceToFromNode = am4core.math.getDistance(event.pointer.point, { x: fromNode.pixelX, y: fromNode.pixelY });
var distanceToToNode = Infinity;
if (toNode) {
distanceToToNode = am4core.math.getDistance(event.pointer.point, { x: toNode.pixelX, y: toNode.pixelY });
}
if (distanceToFromNode < distanceToToNode) {
fromNode.dragStart(event.pointer);
}
else {
toNode.dragStart(event.pointer);
}
})
// add labelsvar labelBullet = chart.links.template.bullets.push(new am4charts.LabelBullet());
labelBullet.label.propertyFields.text = "labelText";
labelBullet.propertyFields.locationX = "labelLocation";
labelBullet.propertyFields.rotation = "labelRotation";
labelBullet.label.horizontalCenter = "left";
labelBullet.label.textAlign = "start";
labelBullet.label.dx = -50;
// add labels which will animatevar bullet = chart.links.template.bullets.push(new am4charts.LabelBullet());
bullet.label.text = "${value}";
bullet.label.fill = am4core.color("#ffffff");
bullet.label.isMeasured = false;
bullet.isMeasured = false;
// create animations
chart.events.on("inited", function () {
for (var i = 0; i < chart.links.length; i++) {
var link = chart.links.getIndex(i);
var bullet = link.bullets.getIndex(1);
bullet.opacity = 0;
if (link.dataItem.toNode && link.dataItem.value > 10) {
bullet.label.fontSize = link.dataItem.value / 10;
firstHalfAnimation(bullet);
}
else {
link.bullets.removeValue(bullet);
}
}
})
functionfirstHalfAnimation(bullet) {
var duration = 6000 * Math.random() + 3000;
var animation = bullet.animate([{ property: "locationX", from: 0.2, to: 0.5 }, { property: "opacity", from: 0, to: 0.3 }], duration)
animation.events.on("animationended", function (event) {
secondHalfAnimation(event.target.object, duration);
})
}
functionsecondHalfAnimation(bullet, duration) {
var animation = bullet.animate([{ property: "locationX", from: 0.5, to: 0.8 }, { property: "opacity", from: 0.3, to: 0 }], duration)
animation.events.on("animationended", function (event) {
setTimeout(function () {
firstHalfAnimation(event.target.object)
}, Math.random() * 5000);
})
}
}); // end am4core.ready()</script><!-- HTML --><!-- chart design inspired by Nicolas Rapp: https://nicolasrapp.com/studio/portfolio/cash-hoarders/ --><divid="chartdiv"></div>
/* Imports */import * as am4core from"@amcharts/amcharts4/core";
import * as am4charts from"@amcharts/amcharts4/charts";
import am4themes_animated from"@amcharts/amcharts4/themes/animated";
/* Chart code */// Themes begin
am4core.useTheme(am4themes_animated);
// Themes endlet chart = am4core.create("chartdiv", am4charts.SankeyDiagram);
chart.data = [
// these are just for color, as properties are taken from data object where the name is first mentioned.
{from:"Cash in the U.S.", color:"#f47b20"},
{from:"Cash Overseas", color:"#000000"},
{ from: "Source", to: "Total non financial companies", value: 1768, color: "#f47b20", labelText: "[font-size:1.5em]2016 BREAKDOWN OF\nTHE U.S.CORPORATE CASH PILE\n\n[/]NON-FINANCIAL COMPANIES \n [bold]$1,768 Trillion[/b]", zIndex: 100 },
{ from: "Total non financial companies", to: "Non-tech companies", value: 907, color: "#f47b20", labelText: "NON-TECH COMPANIES\n [bold]$907 Billion[/]" },
{ from: "Total non financial companies", to: "Tech companies", value: 861, color: "#f47b20", labelText: "TECH COMPANIES\n [bold]861 Billion[/]" },
{ from: "Non-tech companies", to: "Cash in the U.S.", value: 324, color: "#f47b20", zIndex: 101 },
{ from: "Non-tech companies", to: "Cash Overseas", value: 584, color: "#f47b20" },
{ from: "Tech companies", to: "Rest of tech", value: 274, color: "#f47b20", labelText: "REST OF TECH\n[bold]$274 Billion[/]" },
{ from: "Tech companies", to: "Top 5 tech companies", value: 587, color: "#f47b20", labelText: "TOP 5 TECH COMPANIES\n[bold]$587 Billion[/]" },
{ from: "Rest of tech", to: "Cash in the U.S.", value: 74, color: "#f47b20", zIndex: 100 },
{ from: "Rest of tech", to: "Cash Overseas", value: 200, color: "#f47b20" },
{ from: "Top 5 tech companies", to: "Joytechs", value: 67, color: "#f47b20" },
{ from: "Joytechs", to: "Cash in the U.S.", value: 10, color: "#f47b20" },
{ from: "Joytechs", to: "Cash Overseas", value: 57, color: "#f47b20", labelText: "JOYTECHS [bold]$67[/]B", labelLocation: 0, labelRotation: 0 },
{ from: "Top 5 tech companies", to: "Fireex", value: 68, color: "#f47b20" },
{ from: "Fireex", to: "Cash in the U.S.", value: 8, color: "#f47b20" },
{ from: "Fireex", to: "Cash Overseas", value: 60, color: "#f47b20", labelText: "FIREEX [bold]$68[/]B", labelLocation: 0, labelRotation: 0 },
{ from: "Top 5 tech companies", to: "Globalworld", value: 85, color: "#f47b20" },
{ from: "Globalworld", to: "Cash in the U.S.", value: 10, color: "#f47b20" },
{ from: "Globalworld", to: "Cash Overseas", value: 75, color: "#f47b20", labelText: "GLOBALWORLD [bold]$85[/]B", labelLocation: 0, labelRotation: 0 },
{ from: "Top 5 tech companies", to: "Betagate", value: 115, color: "#f47b20" },
{ from: "Betagate", to: "Cash in the U.S.", value: 10, color: "#f47b20" },
{ from: "Betagate", to: "Cash Overseas", value: 105, color: "#f47b20", labelText: "BETAGATE [bold]$115[/]B", labelLocation: 0, labelRotation: 0 },
{ from: "Top 5 tech companies", to: "Apexi", value: 253, color: "#f47b20" },
{ from: "Apexi", to: "Cash in the U.S.", value: 23, color: "#f47b20" },
{ from: "Apexi", to: "Cash Overseas", value: 230, color: "#f47b20", labelText: "APEXI [bold]$253[/]B", labelLocation: 0, labelRotation: 0 },
{ from: "Cash in the U.S.", color: "#f47b20", labelRotation: -90, labelText: "CASH IN THE U.S.\n[bold]$460 BILLION", labelLocation: 0, value: 460, zIndex: 102 },
{ from: "Cash Overseas", color: "#000000", labelText: "[#f47b20 font-size:1.3em]CASH OVERSEAS\n[bold #f47b20 font-size:1.3em]$1,31 TRILLION", labelLocation: 0, labelRotation: -90, value: 1310 }
];
chart.paddingRight = 30;
chart.paddingTop = 80;
chart.paddingBottom = 80;
chart.nodeAlign = "bottom";
chart.minNodeSize = 0.001;
chart.dataFields.fromName = "from";
chart.dataFields.toName = "to";
chart.dataFields.value = "value";
chart.dataFields.color = "color";
let linkTemplate = chart.links.template;
linkTemplate.colorMode = "gradient";
linkTemplate.fillOpacity = 1;
linkTemplate.strokeOpacity = 1;
linkTemplate.cursorOverStyle = am4core.MouseCursorStyle.pointer;
linkTemplate.readerTitle = "drag me!";
linkTemplate.showSystemTooltip = true;
linkTemplate.tooltipText = "";
linkTemplate.propertyFields.zIndex = "zIndex";
linkTemplate.tension = 0.6;
chart.nodes.template.width = 0;
chart.nodes.template.nameLabel.disabled = true;
chart.nodes.template.draggable = true;
chart.nodes.template.inert = true;
chart.nodes.template.togglable = false;
// making links draggable
linkTemplate.events.on("down", function (event) {
let fromNode = event.target.dataItem.fromNode;
let toNode = event.target.dataItem.toNode;
let distanceToFromNode = am4core.math.getDistance(event.pointer.point, { x: fromNode.pixelX, y: fromNode.pixelY });
let distanceToToNode = Infinity;
if (toNode) {
distanceToToNode = am4core.math.getDistance(event.pointer.point, { x: toNode.pixelX, y: toNode.pixelY });
}
if (distanceToFromNode < distanceToToNode) {
fromNode.dragStart(event.pointer);
}
else {
toNode.dragStart(event.pointer);
}
})
// add labelslet labelBullet = chart.links.template.bullets.push(new am4charts.LabelBullet());
labelBullet.label.propertyFields.text = "labelText";
labelBullet.propertyFields.locationX = "labelLocation";
labelBullet.propertyFields.rotation = "labelRotation";
labelBullet.label.horizontalCenter = "left";
labelBullet.label.textAlign = "start";
labelBullet.label.dx = -50;
// add labels which will animatelet bullet = chart.links.template.bullets.push(new am4charts.LabelBullet());
bullet.label.text = "${value}";
bullet.label.fill = am4core.color("#ffffff");
bullet.label.isMeasured = false;
bullet.isMeasured = false;
// create animations
chart.events.on("inited", function () {
for (var i = 0; i < chart.links.length; i++) {
let link = chart.links.getIndex(i);
let bullet = link.bullets.getIndex(1);
bullet.opacity = 0;
if (link.dataItem.toNode && link.dataItem.value > 10) {
bullet.label.fontSize = link.dataItem.value / 10;
firstHalfAnimation(bullet);
}
else {
link.bullets.removeValue(bullet);
}
}
})
functionfirstHalfAnimation(bullet) {
let duration = 6000 * Math.random() + 3000;
let animation = bullet.animate([{ property: "locationX", from: 0.2, to: 0.5 }, { property: "opacity", from: 0, to: 0.3 }], duration)
animation.events.on("animationended", function (event) {
secondHalfAnimation(event.target.object, duration);
})
}
functionsecondHalfAnimation(bullet, duration) {
let animation = bullet.animate([{ property: "locationX", from: 0.5, to: 0.8 }, { property: "opacity", from: 0.3, to: 0 }], duration)
animation.events.on("animationended", function (event) {
setTimeout(function () {
firstHalfAnimation(event.target.object)
}, Math.random() * 5000);
})
}
We use cookies on our website to support technical features that enhance your user experience. We also collect anonymous analytical data, as described in our Privacy policy.