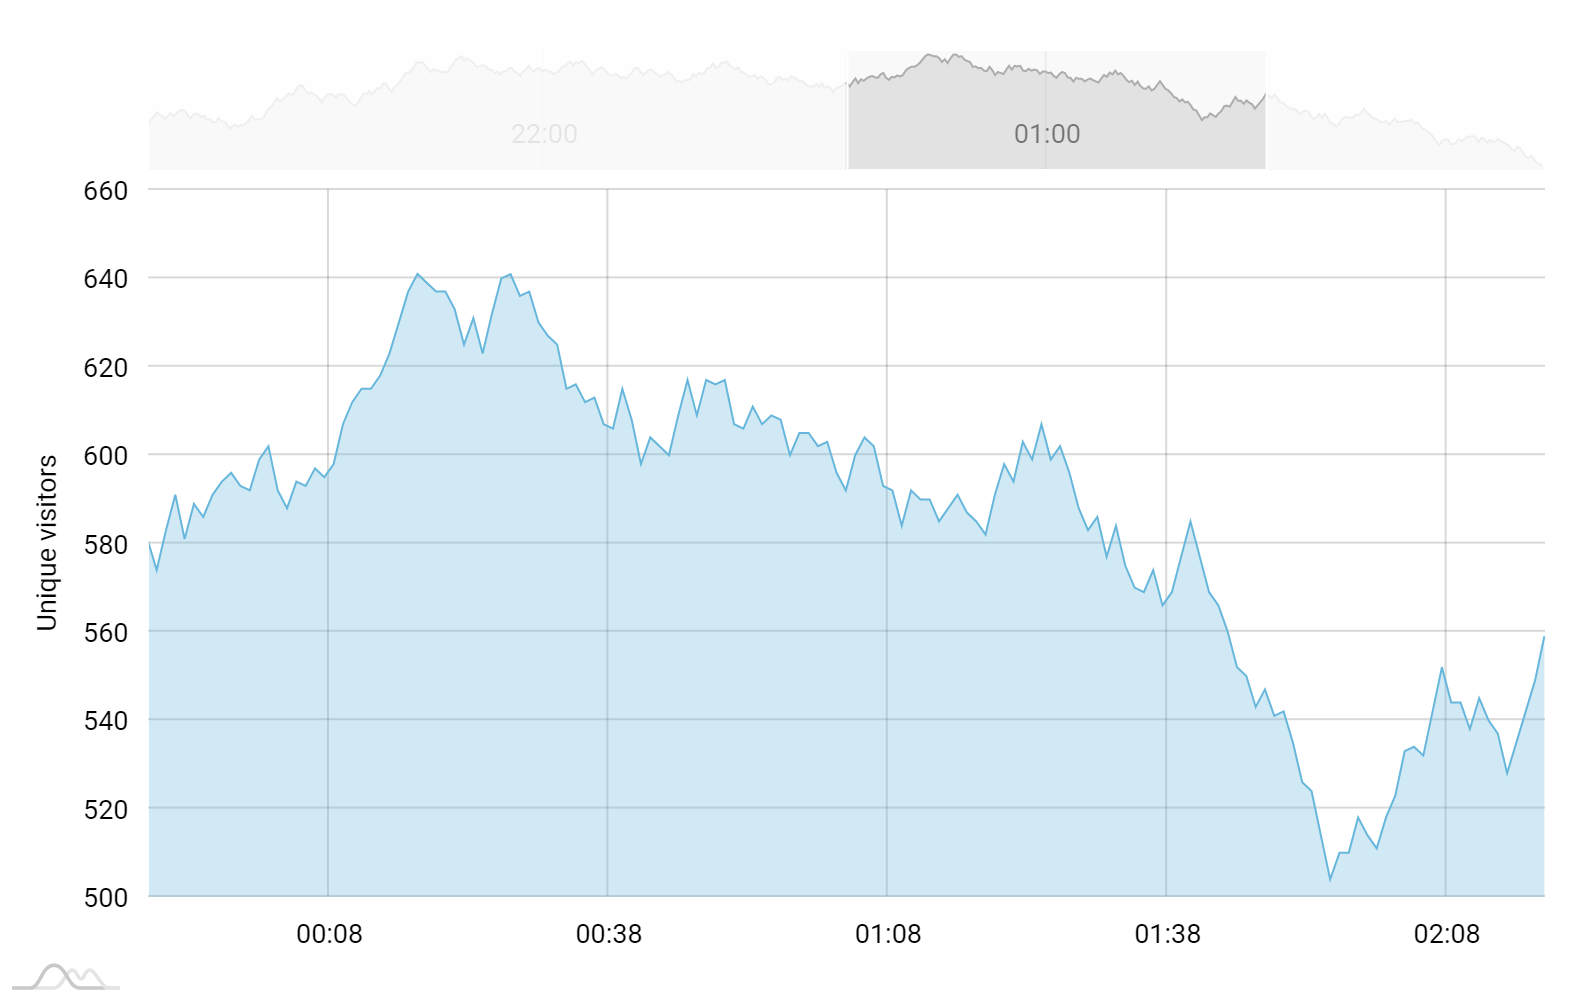
Area With Time Based Data
Zooming via API
Charts provide a strong API that can modify any aspect of the chart on the fly.
You can use zoom() method to zoom the dateAxis. Or, if you want the it to be pre-zoomed intially, you can set dateAxis.start and dateAxis.end values.
More about pre-zooming the chart
Demo source
<!-- Styles -->
<style>
#chartdiv {
  width: 100%;
  height: 500px;
}

</style>

<!-- Resources -->
<script src="https://cdn.amcharts.com/lib/4/core.js"></script>
<script src="https://cdn.amcharts.com/lib/4/charts.js"></script>
<script src="https://cdn.amcharts.com/lib/4/themes/animated.js"></script>

<!-- Chart code -->
<script>
am4core.ready(function() {

// Themes begin
am4core.useTheme(am4themes_animated);
// Themes end

// Create chart
var chart = am4core.create("chartdiv", am4charts.XYChart);
chart.paddingRight = 20;

chart.data = generateChartData();

var dateAxis = chart.xAxes.push(new am4charts.DateAxis());
dateAxis.baseInterval = {
  "timeUnit": "minute",
  "count": 1
};
dateAxis.tooltipDateFormat = "HH:mm, d MMMM";

var valueAxis = chart.yAxes.push(new am4charts.ValueAxis());
valueAxis.tooltip.disabled = true;
valueAxis.title.text = "Unique visitors";

var series = chart.series.push(new am4charts.LineSeries());
series.dataFields.dateX = "date";
series.dataFields.valueY = "visits";
series.tooltipText = "Visits: [bold]{valueY}[/]";
series.fillOpacity = 0.3;


chart.cursor = new am4charts.XYCursor();
chart.cursor.lineY.opacity = 0;
chart.scrollbarX = new am4charts.XYChartScrollbar();
chart.scrollbarX.series.push(series);


dateAxis.start = 0.8;
dateAxis.keepSelection = true;


function generateChartData() {
    var chartData = [];
    // current date
    var firstDate = new Date();
    // now set 500 minutes back
    firstDate.setMinutes(firstDate.getDate() - 500);

    // and generate 500 data items
    var visits = 500;
    for (var i = 0; i < 500; i++) {
        var newDate = new Date(firstDate);
        // each time we add one minute
        newDate.setMinutes(newDate.getMinutes() + i);
        // some random number
        visits += Math.round((Math.random()<0.5?1:-1)*Math.random()*10);
        // add data item to the array
        chartData.push({
            date: newDate,
            visits: visits
        });
    }
    return chartData;
}

}); // end am4core.ready()
</script>

<!-- HTML -->
<div id="chartdiv"></div>