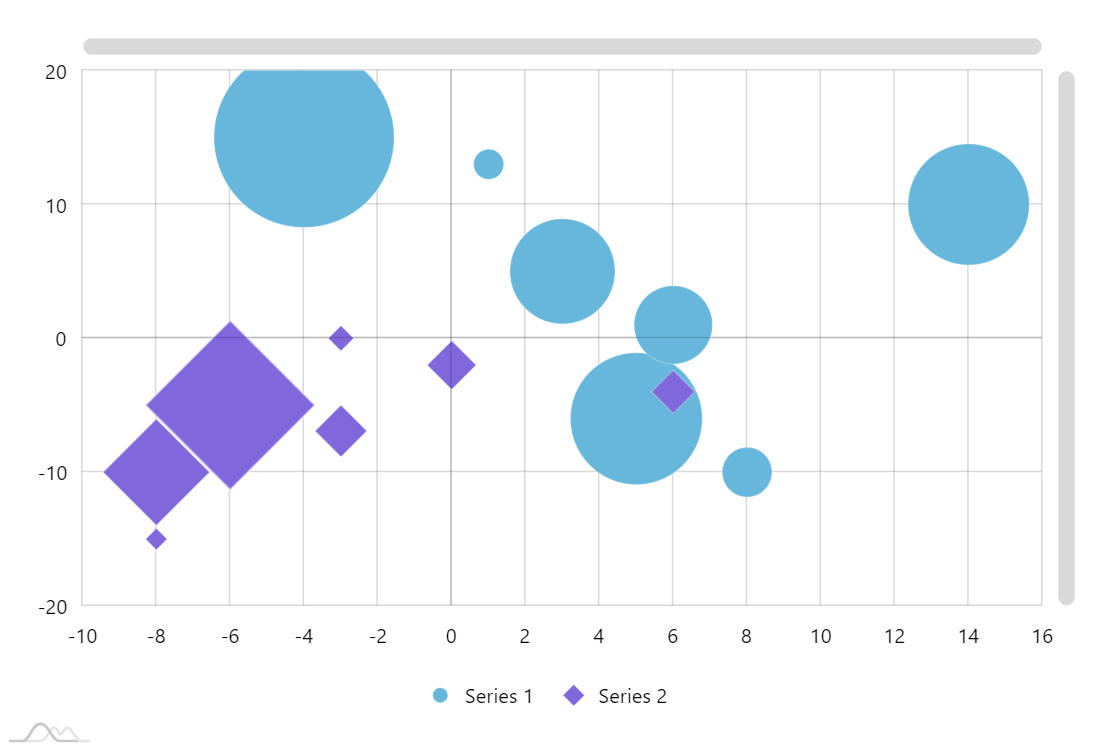
Bubble Chart
Bubble chart displays three dimensions of data: 2 dimensions are represented by the x,y position of the data point, and the third one is represented by its size.
Demo source
<!-- Styles -->
<style>
#chartdiv {
  width: 100%;
  height: 500px;
}
</style>

<!-- Resources -->
<script src="https://cdn.amcharts.com/lib/4/core.js"></script>
<script src="https://cdn.amcharts.com/lib/4/charts.js"></script>
<script src="https://cdn.amcharts.com/lib/4/themes/animated.js"></script>

<!-- Chart code -->
<script>
am4core.ready(function() {

// Themes begin
am4core.useTheme(am4themes_animated);
// Themes end

// Create chart instance
var chart = am4core.create("chartdiv", am4charts.XYChart);
chart.colors.step = 3;

// Add data
chart.data = [ {
  "y": 10,
  "x": 14,
  "value": 59,
  "y2": -5,
  "x2": -3,
  "value2": 44
}, {
  "y": 5,
  "x": 3,
  "value": 50,
  "y2": -15,
  "x2": -8,
  "value2": 12
}, {
  "y": -10,
  "x": 8,
  "value": 19,
  "y2": -4,
  "x2": 6,
  "value2": 35
}, {
  "y": -6,
  "x": 5,
  "value": 65,
  "y2": -5,
  "x2": -6,
  "value2": 168
}, {
  "y": 15,
  "x": -4,
  "value": 92,
  "y2": -10,
  "x2": -8,
  "value2": 102
}, {
  "y": 13,
  "x": 1,
  "value": 8,
  "y2": -2,
  "x2": 0,
  "value2": 41
}, {
  "y": 1,
  "x": 6,
  "value": 35,
  "y2": 0,
  "x2": -3,
  "value2": 16
} ];

// Create axes
var xAxis = chart.xAxes.push(new am4charts.ValueAxis());
xAxis.renderer.minGridDistance = 50;

var yAxis = chart.yAxes.push(new am4charts.ValueAxis());
yAxis.renderer.minGridDistance = 50;

// Create series #1
var series = chart.series.push(new am4charts.LineSeries());
series.dataFields.valueY = "y";
series.dataFields.valueX = "x";
series.dataFields.value = "value";
series.strokeOpacity = 0;
series.name = "Series 1";

var bullet = series.bullets.push(new am4charts.CircleBullet());
bullet.strokeOpacity = 0.2;
bullet.stroke = am4core.color("#ffffff");
bullet.nonScalingStroke = true;
bullet.tooltipText = "x:{valueX} y:{valueY}";
series.heatRules.push({
  target: bullet.circle,
  min: 10,
  max: 60,
  property: "radius"
});

// Create series #2
var series2 = chart.series.push(new am4charts.LineSeries());
series2.dataFields.valueY = "y2";
series2.dataFields.valueX = "x2";
series2.dataFields.value = "value2";
series2.strokeOpacity = 0;
series2.name = "Series 2";

var bullet2 = series2.bullets.push(new am4charts.Bullet());
bullet2.tooltipText = "x:{valueX} y:{valueY}";
bullet2.layout = "absolute";
bullet2.rotation = 45;

var rectangle = bullet2.createChild(am4core.Rectangle);
rectangle.verticalCenter = "middle";
rectangle.horizontalCenter = "middle";
rectangle.width = 10;
rectangle.height = 10;
rectangle.strokeOpacity = 0.5;
rectangle.stroke = am4core.color("#ffffff");
rectangle.nonScalingStroke = true;

rectangle.verticalCenter = "middle";
rectangle.horizontalCenter = "middle";

series2.heatRules.push({
  target: rectangle,
  min: 1,
  max: 8,
  property: "scale"
});

chart.scrollbarX = new am4core.Scrollbar();
chart.scrollbarY = new am4core.Scrollbar();

chart.legend = new am4charts.Legend();

}); // end am4core.ready()
</script>

<!-- HTML -->
<div id="chartdiv"></div>