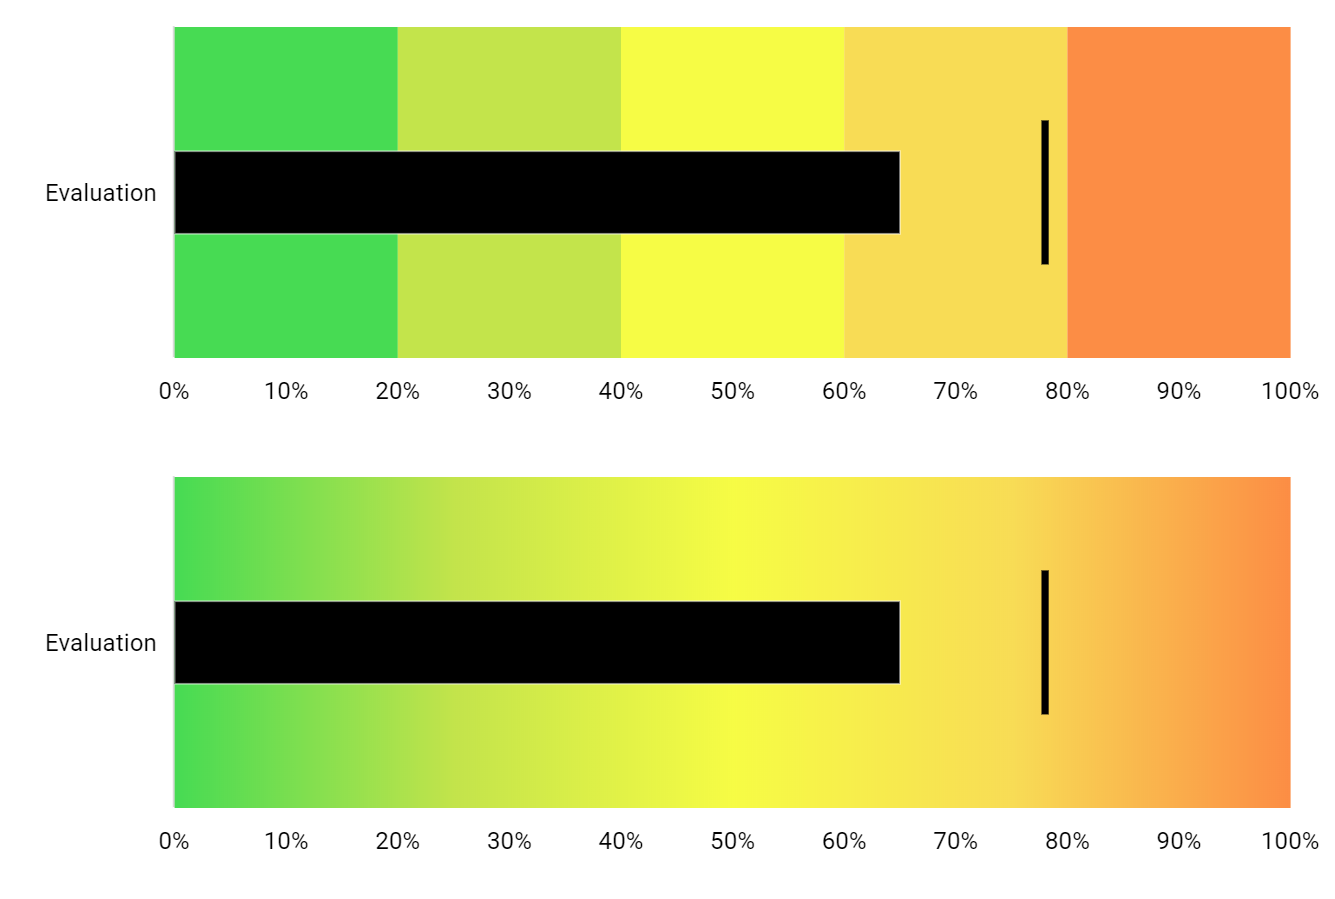
Bullet Chart
Bullet Chart (also know as Bullet graph) is a great replacement for traditional dashboard gauges and meters. It empowers to display way more information in a more compact space by getting rid of unnecessary decoration in favor of data clarity and usability.
Demo source
<!-- Styles -->
<style>
#chartdiv {
  width: 100%;
  height: 500px;
}

</style>

<!-- Resources -->
<script src="https://cdn.amcharts.com/lib/4/core.js"></script>
<script src="https://cdn.amcharts.com/lib/4/charts.js"></script>
<script src="https://cdn.amcharts.com/lib/4/themes/animated.js"></script>

<!-- Chart code -->
<script>
am4core.ready(function() {

// Themes begin
am4core.useTheme(am4themes_animated);
// Themes end


var container = am4core.create("chartdiv", am4core.Container);
container.width = am4core.percent(100);
container.height = am4core.percent(100);
container.layout = "vertical";

createBulletChart(container, "solid");
createBulletChart(container, "gradient");

/* Create ranges */
function createRange(axis, from, to, color) {
  var range = axis.axisRanges.create();
  range.value = from;
  range.endValue = to;
  range.axisFill.fill = color;
  range.axisFill.fillOpacity = 0.8;
  range.label.disabled = true;
  range.grid.disabled = true;
}

/* Create bullet chart with specified color type for background */
function createBulletChart(parent, colorType) {
  var colors = ["#19d228", "#b4dd1e", "#f4fb16", "#f6d32b", "#fb7116"];

  /* Create chart instance */
  var chart = container.createChild(am4charts.XYChart);
  chart.paddingRight = 25;

  /* Add data */
  chart.data = [{
    "category": "Evaluation",
    "value": 65,
    "target": 78
  }];

  /* Create axes */
  var categoryAxis = chart.yAxes.push(new am4charts.CategoryAxis());
  categoryAxis.dataFields.category = "category";
  categoryAxis.renderer.minGridDistance = 30;
  categoryAxis.renderer.grid.template.disabled = true;

  var valueAxis = chart.xAxes.push(new am4charts.ValueAxis());
  valueAxis.renderer.minGridDistance = 30;
  valueAxis.renderer.grid.template.disabled = true;
  valueAxis.min = 0;
  valueAxis.max = 100;
  valueAxis.strictMinMax = true;
  valueAxis.numberFormatter.numberFormat = "#'%'";
  valueAxis.renderer.baseGrid.disabled = true;

  /*
    In order to create separate background colors for each range of values,
    you have to create multiple axisRange objects each with their own fill color
  */
  if (colorType === "solid") {
    var start = 0, end = 20;
    for (var i = 0; i < 5; ++i) {
      createRange(valueAxis, start, end, am4core.color(colors[i]));
      start += 20;
      end += 20;
    }
  }
  /*
    In order to create a gradient background, only one axisRange object is needed
    and a gradient object can be assigned to the axisRange's fill property.
  */
  else if (colorType === "gradient") {
    var gradient = new am4core.LinearGradient();
    for (var i = 0; i < 5; ++i) {
      // add each color that makes up the gradient
      gradient.addColor(am4core.color(colors[i]));
    }
    createRange(valueAxis, 0, 100, gradient);
  }

  /* Create series */
  var series = chart.series.push(new am4charts.ColumnSeries());
  series.dataFields.valueX = "value";
  series.dataFields.categoryY = "category";
  series.columns.template.fill = am4core.color("#000");
  series.columns.template.stroke = am4core.color("#fff");
  series.columns.template.strokeWidth = 1;
  series.columns.template.strokeOpacity = 0.5;
  series.columns.template.height = am4core.percent(25);
  series.tooltipText = "{value}"


  var series2 = chart.series.push(new am4charts.StepLineSeries());
  series2.dataFields.valueX = "target";
  series2.dataFields.categoryY = "category";
  series2.strokeWidth = 3;
  series2.noRisers = true;
  series2.startLocation = 0.15;
  series2.endLocation = 0.85;
  series2.tooltipText = "{valueX}"
  series2.stroke = am4core.color("#000");

  chart.cursor = new am4charts.XYCursor()
  chart.cursor.lineX.disabled = true;
  chart.cursor.lineY.disabled = true;

  valueAxis.cursorTooltipEnabled = false;
  chart.arrangeTooltips = false;
}

}); // end am4core.ready()
</script>

<!-- HTML -->
<div id="chartdiv"></div>