Changing map projection
Multi-projection support
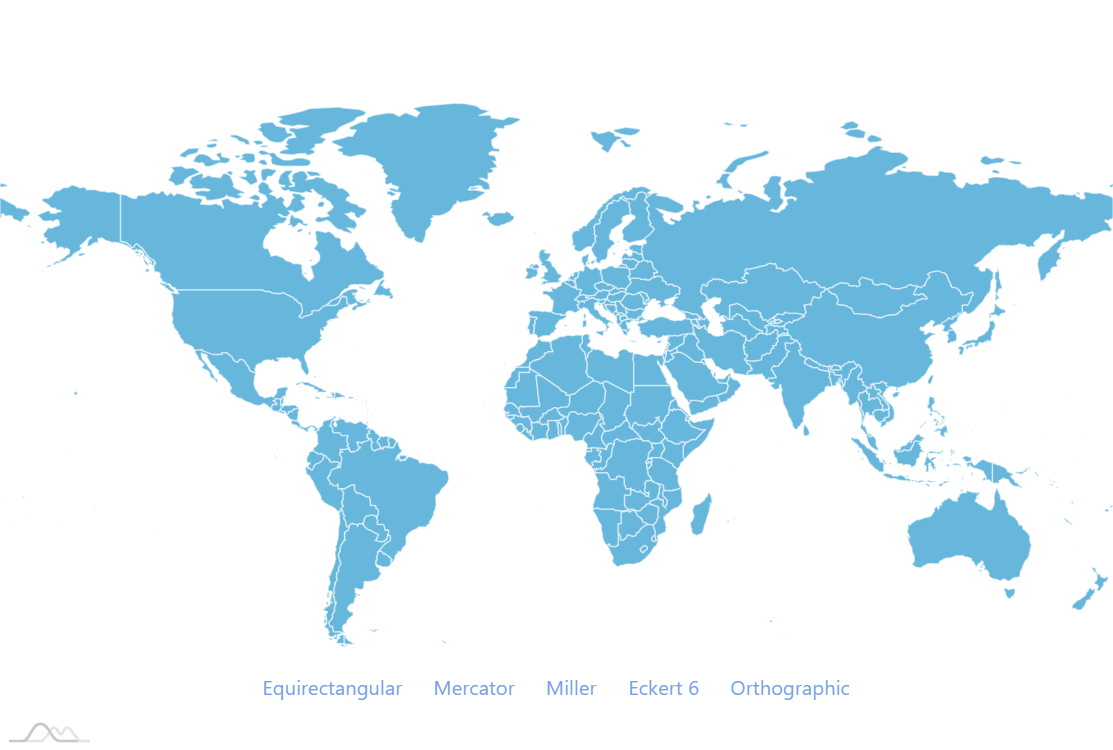
amCharts 4 supports different chart projections, like Eckert 6, Mercator, Miller, Orthographic, and default Equirectangular. Besides a solid list of built-in projections, amCharts 4 Map Chart can use any projection from D3 and related packages.
Changin projection on the fly
It’s easy to change map’s projection on the fly, even if map is already initialized. Just set its projection property to a projection object and you’re all set.
Want more fun? try to pan the map!
Demo source
<!-- Styles -->
<style>
#chartdiv {
  width: 100%;
  height: 500px;
}

</style>

<!-- Resources -->
<script src="https://cdn.amcharts.com/lib/4/core.js"></script>
<script src="https://cdn.amcharts.com/lib/4/maps.js"></script>
<script src="https://cdn.amcharts.com/lib/4/geodata/worldLow.js"></script>
<script src="https://cdn.amcharts.com/lib/4/themes/animated.js"></script>

<!-- Chart code -->
<script>
am4core.ready(function() {

// Themes begin
am4core.useTheme(am4themes_animated);
// Themes end

// Create map instance
var chart = am4core.create("chartdiv", am4maps.MapChart);

// Set map definition
chart.geodata = am4geodata_worldLow;

// Set projection
chart.projection = new am4maps.projections.Miller();
chart.panBehavior = "rotateLongLat";

var grid = chart.series.push(new am4maps.GraticuleSeries());
grid.toBack();

// Create map polygon series
var polygonSeries = chart.series.push(new am4maps.MapPolygonSeries());

// Make map load polygon (like country names) data from GeoJSON
polygonSeries.useGeodata = true;
polygonSeries.mapPolygons.template.nonScalingStroke = true;
polygonSeries.mapPolygons.template.strokeOpacity = 0.5;

// Configure series
var polygonTemplate = polygonSeries.mapPolygons.template;
polygonTemplate.tooltipText = "{name}";
polygonTemplate.fill = chart.colors.getIndex(0);

// Create hover state and set alternative fill color
var hs = polygonTemplate.states.create("hover");
hs.properties.fill = chart.colors.getIndex(0).brighten(-0.5);

let linkContainer = chart.createChild(am4core.Container);
linkContainer.isMeasured = false;
linkContainer.layout = "horizontal";
linkContainer.x = am4core.percent(50);
linkContainer.y = am4core.percent(90);
linkContainer.horizontalCenter = "middle";

let equirectangular= linkContainer.createChild(am4core.TextLink);
equirectangular.margin(10,10,10,10);
equirectangular.text = "Equirectangular";
equirectangular.events.on("hit", function(){
    chart.projection = new am4maps.projections.Projection();
})

let mercator = linkContainer.createChild(am4core.TextLink);
mercator.text = "Mercator";
mercator.margin(10,10,10,10);
mercator.events.on("hit", function(){
    chart.projection = new am4maps.projections.Mercator();
})

let miller = linkContainer.createChild(am4core.TextLink);
miller.margin(10,10,10,10);
miller.text = "Miller";
miller.events.on("hit", function(){
    chart.projection = new am4maps.projections.Miller();
})

let eckert = linkContainer.createChild(am4core.TextLink);
eckert.margin(10,10,10,10);
eckert.text = "Eckert 6";
eckert.events.on("hit", function(){
    chart.projection = new am4maps.projections.Eckert6();
})

let orthographic = linkContainer.createChild(am4core.TextLink);
orthographic.margin(10,10,10,10);
orthographic.text = "Orthographic";
orthographic.events.on("hit", function(){
    chart.projection = new am4maps.projections.Orthographic();
})


}); // end am4core.ready()
</script>

<!-- HTML -->
<div id="chartdiv"></div>