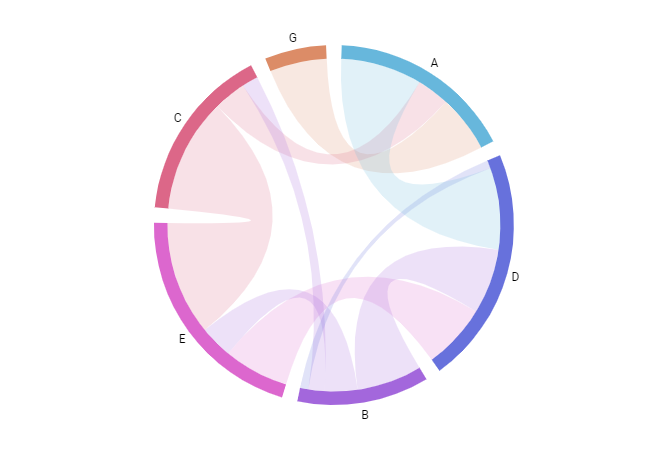
Chord diagram
Chord Diagrams (also known as Radial network diagram, Chord layout, Dependency wheel) help us visualize relationships between data arranged beautifully in a circle. You can use Chord Diagrams to visualize data ranging from relationships between Lost characters to Uber rides between neighborhoods in a city to complex scientific subjects that are even hard to pronounce.
amCharts 4 includes powerful tools to create your own interactive Chord Diagrams. Users can explore the chart, switch certain data points off and on, and more. Check out the Anatomy of a Chord Diagram in the documentation to see a comprehensive tutorial for implementing a Chord Diagram in your own web projects.
Demo source
<!-- Styles -->
<style>
#chartdiv {
  width: 100%;
  height: 500px;
}
</style>

<!-- Resources -->
<script src="https://cdn.amcharts.com/lib/4/core.js"></script>
<script src="https://cdn.amcharts.com/lib/4/charts.js"></script>
<script src="https://cdn.amcharts.com/lib/4/themes/animated.js"></script>

<!-- Chart code -->
<script>
am4core.ready(function() {

// Themes begin
am4core.useTheme(am4themes_animated);
// Themes end

var chart = am4core.create("chartdiv", am4charts.ChordDiagram);
chart.hiddenState.properties.opacity = 0;

chart.data = [
    { from: "A", to: "D", value: 10 },
    { from: "B", to: "D", value: 8 },
    { from: "B", to: "E", value: 4 },
    { from: "B", to: "C", value: 2 },
    { from: "C", to: "E", value: 14 },
    { from: "E", to: "D", value: 8 },
    { from: "C", to: "A", value: 4 },
    { from: "G", to: "A", value: 7 },
    { from: "D", to: "B", value: 1 }
];

chart.dataFields.fromName = "from";
chart.dataFields.toName = "to";
chart.dataFields.value = "value";

// make nodes draggable
var nodeTemplate = chart.nodes.template;
nodeTemplate.readerTitle = "Click to show/hide or drag to rearrange";
nodeTemplate.showSystemTooltip = true;
nodeTemplate.cursorOverStyle = am4core.MouseCursorStyle.pointer

}); // end am4core.ready()
</script>

<!-- HTML -->
<div id="chartdiv"></div>